 投稿系统
投稿系统

The link between dietary nutrients intake and cardiovascular diseases in cold regions
doi: 10.2478/fzm-2024-0001
-
Abstract:
Background The cold winter weather in northern China influences the dietary habits of its residents, contributing to a heightened risk of cardiovascular disorders, such as hypertension and coronary heart disease. Key factors include low vegetable consumption and high salt and fat intakes. This study aims to investigate the relationships between northern dietary nutrient intake in northern China and cardiovascular disorders during the winter season. Methods A food frequency questionnaire tailored to the actual eating habits in northern China was designed. Retrospective data from 955 Chinese adults were collected from November to March between 2014 to 2023. Logistic regression was employed to analyze the relationship between dietary nutrients and cardiovascular diseases, with model performance assessed using receiver operating characteristic (ROC) curves. Results Adjusted for gender, age, and body mass index (BMI), an inverse association was observed between vitamin A (OR = 0.706, 95% CI: 0.550, 0.907), nicotinic acid (OR = 0.584, 95% CI: 0.447, 0.762), phosphorus (OR = 0.777, 95% CI: 0.608, 0.994), selenium (OR = 0.719, 95% CI: 0.560, 0.923), zinc (OR = 0.683, 95% CI: 0.531, 0.880), methionine (OR = 0.730, 95% CI: 0.569, 0.936), arginine (OR = 0.753, 95% CI: 0.588, 0.964), lysine (OR = 0.706, 95% CI: 0.550, 0.907), aspartic acid (OR = 0.730, 95% CI: 0.569, 0.936) and hypertension. Additionally, a negative association was found between niacin (OR = 0.752, 95% CI: 0.597, 0.946) and coronary heart disease. Conversely, a positive association was identified between iodine and hypertension (OR = 1.305, 95% CI: 1.020, 1.669) and coronary heart disease (OR = 1.301, 95% CI: 1.037, 1.634). Conclusion Our study suggests that maintaining a balanced dietary intake of vitamin A, niacin, phosphorus, selenium, zinc, methionine, arginine, lysine, and aspartic acid can be beneficial in preventing hypertension. Adequate niacin intake is associated with a lower risk of coronary heart disease. However, excessive iodine intake may contribute to hypertension and coronary heart disease. -
Key words:
- nutrients /
- northern /
- hypertension /
- coronary heart disease /
- cold
-

Figure 1. Areas under receiver operating characteristic curves of hypertension. A, protein; B, Vitamins; C, Minerals; D, Amino acids (Adjusted estimation: adjusted for gender, age, and BMI).

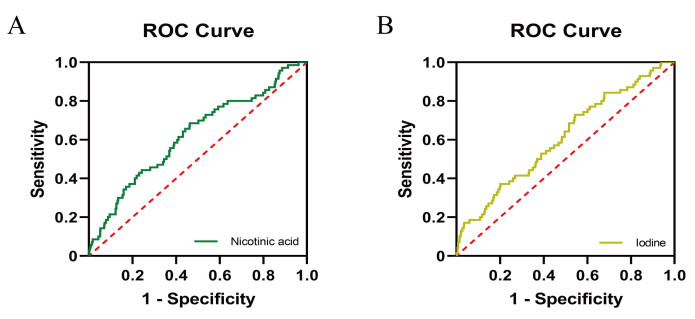
Figure 2. Areas under receiver operating characteristic curves of coronary heart disease. A, Nicotinic acid; B, Iodine (Adjusted estimation: adjusted for gender, age, and BMI).
Table 1. Characteristics of variables in cardiovascular disease patients and controls
Group Age group Body Mass Index Male, N (%) Protein (g) Fat (g) Carbohydrate (g) Hypertension No (N = 898) 28.00(26.00, 33.00) 20.79 (19.22, 23.33) 333.00 (94.07%) 90.51 (60.45, 122.12) 72.22 (45.87, 106.79) 387.04 (272.79, 509.90) Yes (N = 57) 28.00 (26.00, 37.50) 21.26 (19.6, 24.42) 21.00 (5.93%) 80.08 (56.27, 122.17) 64.27 (46.28, 88.20) 372.50 (285.82, 615.75) P-value 0.555 0.125 < 0.001 0.388 0.197 0.419 Coronary Heart Disease No (N = 885) 28.00 (26.00, 33.00) 20.82 (19.23, 23.39) 333.00 (94.07%) 90.42 (60.58, 122.17) 71.79 (45.66, 106.79) 388.28 (274.42, 511.81) Yes (N = 70) 28.00 (27.00, 40.25) 21.11 (19.31, 23.09) 21.00 (5.93%) 80.80 (53.28, 122.71) 69.33 (48.50, 87.80) 365.41 (224.89, 531.62) P-value 0.023 0.858 < 0.001 0.185 0.694 0.474 Group Riboflavin (mg) Thiamine (mg) Vitamin A (μg) Vitamin B6 (mg) Vitamin C (mg) Vitamin E (mg) Hypertension No (N = 898) 1.41 (0.92, 2.05) 1.20 (0.82, 1.63) 925.54 (517.59, 1, 710.44) 0.24 (0.14, 0.44) 120.08 (58.28, 209.39) 40.14 (24.87, 60.68) Yes (N = 57) 1.32 (0.82, 2.03) 1.16 (0.80, 1.89) 801.00 (284.87, 1, 343.33) 0.24 (0.10, 0.53) 106.95 (61.73, 202.70) 38.23 (20.55, 64.54) P-value 0.613 0.904 0.029 0.673 0.625 0.733 Coronary Heart Disease No (N = 885) 1.41 (0.93, 2.06) 1.20 (0.82, 1.64) 943.71 (519.69, 1705.79) 0.25 (0.13, 0.44) 121.98 (59.64, 213.96) 40.41 (24.92, 61.45) Yes (N = 70) 1.22 (0.76, 1.93) 1.06 (0.74, 1.59) 735.89 (296.19, 1354.86) 0.21 (0.11, 0.46) 98.92 (48.79, 155.37) 34.64 (22.31, 56.64) P-value 0.193 0.305 0.025 0.555 0.046 0.249 Group Niacin (mg) Folic acid (μg) Iodine (μg) Calcium (mg) Potassium (mg) Phosphorus (mg) Hypertension No (N = 898) 20.38 (13.83, 28.73) 73.84 (41.44, 128.70) 81.86 (42.70, 125.39) 615.41 (375.11, 934.22) 2, 542.93 (1, 615.01, 3, 642.86) 1, 362.93 (919.71, 1, 860.15) Yes (N = 57) 18.00 (11.22, 29.79) 62.65 (25.54, 122.97) 104.42 (68.04, 153.63) 597.23 (340.93, 997.81) 2, 482.19 (1, 470.94, 4, 019.28) 1, 277.14 (832.72, 1, 899.95) P-value 0.225 0.238 0.013 0.862 0.788 0.524 Coronary Heart Disease No (N = 885) 20.48 (13.76, 29.03) 73.97 (41.39, 127.68) 81.89 (42.21, 124.60) 618.73 (380.44, 935.29) 2,560.09 (1,637.66, 3,668.76) 1,362.79 (918.85, 1,878.76) Yes (N = 70) 18.04 (10.95, 26.21) 59.07 (27.64, 146.35) 101.22 (68.07, 171.15) 543.73 (343.58, 939.36) 2,322.45 (1,449.14, 3,353.92) 1,183.31 (782.70, 1,812.27) P-value 0.119 0.292 0.002 0.247 0.181 0.221 Group Magnesium (mg) Manganese (mg) Sodium (mg) Iron (mg) Copper (mg) Selenium (μg) Hypertension No (N = 898) 440.03 (298.73, 645.32) 7.53 (5.34, 10.47) 2,568.41 (1,704.26, 3,732.52) 25.70 (17.67, 36.19) 3.40 (2.33, 4.94) 63.46 (39.46, 94.65) Yes (N = 57) 433.98 (260.22, 675.52) 7.22 (4.78, 11.47) 3,026.25 (2,014.28, 4,098.46) 25.03 (16.99, 41.12) 3.28 (2.29, 5.05) 56.61 (37.66, 95.31) P-value 0.806 0.790 0.111 0.887 0.741 0.387 Coronary Heart Disease No (N = 885) 442.46 (298.1, 647.99) 7.57 (5.33, 10.46) 2,562.77 (1,700.28, 3,728.87) 25.67 (17.67, 36.73) 3.41 (2.35, 4.92) 63.46 (39.40, 95.16) Yes (N = 70) 412.58 (271.69, 595.50) 6.61 (5.13, 10.96) 2,983.25 (1,941.12, 4,107.40) 23.94 (17.17, 36.85) 3.23 (2.21, 5.03) 55.46 (34.62, 85.42) P-value 0.342 0.347 0.041 0.740 0.247 0.175 Group Zinc (mg) Phenylalanine (mg) Alanine (mg) Methionine (mg) Glycine (mg) Glutamic (mg) Hypertension No (N = 898) 14.37 (10.29, 20.04) 2, 452.74 (1, 429.96, 3, 503.79) 2, 704.55 (1, 582.74, 4, 057.18) 804.74 (471.40, 1, 215.04) 2,491.57 (1,430.86, 3,693.00) 10,006.82 (6,099.84, 14,887.29) Yes (N = 57) 13.36 (8.73, 19.64) 2, 102.83 (1, 499.31, 3, 688.03) 2, 171.41 (1, 622.00, 4, 272.82) 645.85 (465.14, 1, 219.02) 2,094.41 (1,495.31, 3,764.14) 9,515.27 (6,221.20, 15,955.90) P-value 0.355 0.557 0.357 0.17 0.404 0.913 Coronary Heart Disease No (N = 885) 14.39 (10.30, 20.05) 2, 450.90 (1, 445.22, 3, 531.06) 2, 709.43 (1, 601.39, 4, 072.64) 806.53 (478.10, 1, 227.53) 2,491.04 (1,447.51, 3,729.27) 10,167.11 (6,133.60, 14,999.23) Yes (N = 70) 12.71 (8.58, 19.92) 1, 964.76 (1, 330.83, 3, 073.76) 2, 274.25 (1, 465.48, 3, 518.46) 650.94 (411.30, 1, 103.53) 2,073.89 (1,408.37, 3,299.27) 8,312.50 (5,751.56, 13,982.29) P-value 0.249 0.147 0.115 0.053 0.172 0.216 Group Cystine (mg) Arginine (mg) Lysine (mg) Tyrosine (mg) Leucine (mg) Proline (mg) Hypertension No (N = 898) 844.43 (494.29, 1, 259.87) 3, 335.42 (1, 923.87, 4, 976.38) 3, 206.37 (1, 909.13, 4, 869.15) 1, 819.72 (1, 077.51, 2, 674.60) 4,175.34 (2,465.20, 6,157.57) 3,051.24 (1,844.42, 4,506.25) Yes (N = 57) 838.53 (484.25, 1, 484.28) 2, 523.52 (1, 886.05, 5, 025.71) 2, 604.95 (1, 729.35, 4, 460.87) 1, 501.33 (1, 126.23, 2, 802.08) 3,535.24 (2,626.79, 6,196.59) 3,271.71 (1,821.18, 5,588.25) P-value 0.629 0.237 0.130 0.443 0.474 0.467 Coronary Heart Disease No (N = 885) 854.68 (497.82, 1, 290.68) 3, 337.59 (1, 922.76, 5, 003.71) 3, 208.75 (1, 916.36, 4, 930.73) 1, 819.53 (1, 086.62, 2, 684.79) 4,178.11 (2,487.75, 6,200.85) 3,117.56 (1,847.31, 4,557.99) Yes (N = 70) 710.08 (463.58, 1, 202.81) 2, 815.21 (1, 882.05, 4, 812.81) 2, 597.67 (1, 734.08, 4, 404.98) 1, 477.30 (976.56, 2, 359.55) 3,432.64 (2,230.87, 5,298.00) 2,633.85 (1,762.23, 4,403.17) P-value 0.223 0.198 0.090 0.118 0.119 0.226 Group Tryptophan (mg) Serine (mg) Threonine (mg) Aspartic (mg) Valine (mg) Isoleucine (mg) Histidine (mg) Hypertension No (N = 898) 682.79 (410.16, 998.28) 2,443.07 (1,444.74, 2,174.30 (1,283.10, 4,910.27 (2,923.00, 2,634.84 (1,583.07, 2,361.87 (1,420.43, 1,367.87 (812.18, 3,512.75) 3,169.26) 7,249.60) 3,837.36) 3,490.25) 2,034.38) Yes (N = 57) 584.06 (445.65, 1006.89) 2,133.17 (1,504.37, 1,809.59 (1,357.18, 3,784.74 (2,772.53, 2,303.76 (1,681.28, 1,932.22 (1,511.23, 1,128.85 (852.37, 3,817.04) 3,271.83) 7,818.86) 4,042.45) 3,764.42) 2,121.03) P-value 0.630 0.688 0.443 0.258 0.497 0.349 0.429 Coronary Heart Disease No (N = 885) 683.64 (417.80, 1009.06) 2,443.68 (1,463.02, 2,181.23 (1,303.60, 4,919.08 (2,956.43, 2,635.44 (1,601.45, 2,362.93 (1,438.17, 1,367.91 (825.89, 3,538.73) 3,180.69) 7,277.07) 3,873.66) 3,524.50) 2,039.53) Yes (N = 70) 555.24 (373.39, 925.48) 1,950.61 (1,306.93, 1,794.58 (1,200.29, 4,018.36 (2,743.24, 2,165.47 (1,460.66, 1,932.71 (1,321.35, 1,140.37 (730.45, 3,361.83) 2,818.03) 6,782.53) 3,302.72) 3,220.44) 1,812.08) P-value 0.182 0.147 0.125 0.119 0.136 0.130 0.136 Data are presented as numbers (percentage) for categorical variables or 50th (25th, 75th) for continuous variables.  下载: 导出CSV
Table 2. ORs and 95% CIs for hypertension and coronary heart disease according to the quartiles of nutrient density.
Nutrient density Crude Model 1 OR 95% CI P-value OR 95% CI P-value Hypertension Protein 0.661** 0.512–0.853 0.001 0.658** 0.506–0.856 0.002 Fat 0.949 0.747–0.206 0.669 0.962 0.756–0.224 0.755 Carbohydrate 1.263 0.989–0.613 0.061 1.248 0.972–0.603 0.083 Coronary heart disease Protein 0.829 0.664–0.033 0.095 0.837 0.667–0.050 0.124 Fat 1.236 0.991–0.543 0.060 1.231 0.985–0.537 0.067 Carbohydrate 0.986 0.793–0.226 0.902 0.975 0.779–0.219 0.822 CI, confidence interval; OR, odds ratio; Crude has not been adjusted by any potential factors; Model 1 has been adjusted by age, gender and body mass index; *P < 0.05 or **P < 0.01.
下载: 导出CSV
Table 3. Associations between the quartiles of nutrient density and hypertension
Nutrient density Crude Model 1 OR 95% CI P-value OR 95% CI P-value Vitamins Riboflavin 0.827 0.649–0.055 0.126 0.823 0.644–0.052 0.120 Thiamine 0.948 0.746–0.205 0.661 0.922 0.721–0.178 0.516 Vitamin A 0.706** 0.550–0.907 0.007 0.678** 0.525–0.875 0.003 Vitamin B6 0.879 0.691–0.119 0.295 0.863 0.676–0.102 0.238 Vitamin C 0.906 0.712–0.152 0.421 0.900 0.698–0.160 0.415 Vitamin E 0.948 0.746–0.205 0.661 0.970 0.760–0.238 0.806 Niacin 0.584** 0.447–0.762 < 0.001 0.588** 0.449–0.771 < 0.001 Folic acid 0.816 0.640–0.041 0.101 0.805 0.630–0.028 0.083 Minerals Lodine 1.305* 1.020–0.669 0.034 1.316* 1.026–0.688 0.031 Calcium 0.920 0.723–0.169 0.495 0.920 0.716–0.182 0.514 Potassium 0.866 0.680–0.102 0.242 0.857 0.665–0.104 0.232 Phosphorus 0.777* 0.608–0.994 0.044 0.778* 0.606–0.999 0.049 Magnesium 0.892 0.702–0.135 0.354 0.868 0.673–0.119 0.273 Manganese 0.866 0.680–0.102 0.242 0.815 0.635–0.046 0.108 Sodium 1.187 0.932–0.513 0.165 1.220 0.953–0.562 0.114 Iron 0.892 0.702–0.135 0.354 0.877 0.686–0.120 0.293 Copper 1.037 0.816–0.317 0.768 1.018 0.798–0.298 0.885 Selenium 0.719* 0.560–0.923 0.010 0.718* 0.558–0.924 0.010 Zinc 0.683** 0.531–0.880 0.003 0.672** 0.520–0.868 0.002 Amino acids Phenylalanine 0.934 0.734–0.187 0.575 0.949 0.739–0.220 0.685 Alanine 0.840 0.659–0.070 0.158 0.852 0.661–0.097 0.214 Methionine 0.730* 0.569–0.936 0.013 0.740* 0.572–0.958 0.022 Glycine 0.892 0.702–0.135 0.354 0.907 0.706–0.166 0.447 Glutamic 1.052 0.828–0.337 0.677 1.074 0.838–0.377 0.572 Cystine 1.117 0.878–0.422 0.366 1.129 0.884–0.442 0.331 Arginine 0.753* 0.588–0.964 0.025 0.757* 0.586–0.978 0.033 Lysine 0.706** 0.550–0.907 0.007 0.715* 0.550–0.929 0.012 Tyrosine 0.840 0.659–0.070 0.158 0.848 0.658–0.093 0.202 Leucine 0.920 0.723–0.169 0.495 0.937 0.730–0.203 0.611 Proline 1.117 0.878–0.422 0.366 1.141 0.890–0.463 0.297 Tryptophan 0.920 0.723–0.169 0.495 0.940 0.732–0.206 0.625 Serine 0.948 0.746–0.205 0.661 0.961 0.749–0.233 0.756 Threonine 0.866 0.680–0.102 0.242 0.880 0.684–0.132 0.321 Aspartic 0.730* 0.569–0.936 0.013 0.731* 0.563–0.948 0.018 Valine 0.920 0.723–0.169 0.495 0.936 0.730–0.202 0.606 Lsoleucine 0.853 0.670–0.086 0.197 0.859 0.668–0.104 0.235 Histidine 0.879 0.691–0.119 0.295 0.898 0.698–0.154 0.400 Notes: CI, confidence interval; OR, odds ratio; Crude has not been adjusted by any potential factors; Model 1 has been adjusted by age, gender and Body Mass Index; *P < 0.05 or **P < 0.01.
下载: 导出CSV
Table 4. Associations between the quartiles of nutrient density and coronary heart disease
Nutrient density Crude Model 1 OR 95% CI P-value OR 95% CI P-value Vitamins Riboflavin 0.882 0.709–0.098 0.262 0.856 0.685–0.070 0.172 Thiamine 0.927 0.745–0.153 0.498 0.885 0.706–0.108 0.285 Vitamin A 0.829 0.664–0.033 0.095 0.808 0.644–0.015 0.066 Vitamin B6 0.951 0.764–0.182 0.648 0.929 0.745–0.158 0.510 Vitamin C 0.871 0.700–0.085 0.218 0.813 0.644–0.026 0.081 Vitamin E 0.905 0.727–0.125 0.368 0.906 0.726–0.131 0.383 Niacin 0.728** 0.581–0.912 0.006 0.752* 0.597–0.946 0.015 Folic acid 0.964 0.775–0.199 0.742 0.939 0.754–0.169 0.572 Minerals Lodine 1.336* 1.068–0.672 0.011 1.301* 1.037–0.634 0.023 Calcium 0.974 0.784–0.211 0.815 0.927 0.737–0.165 0.515 Potassium 0.893 0.718–0.112 0.312 0.841 0.668–0.059 0.141 Phosphorus 0.882 0.709–0.098 0.262 0.877 0.700–0.098 0.253 Magnesium 0.905 0.727–0.125 0.368 0.846 0.672–0.067 0.157 Manganese 0.893 0.718–0.112 0.312 0.846 0.675–0.060 0.145 Sodium 1.267* 1.014–0.582 0.037 1.253 0.997–0.576 0.053 Iron 0.999 0.803–0.242 0.990 0.964 0.772–0.205 0.748 Copper 0.916 0.736–0.139 0.430 0.878 0.704–0.095 0.248 Selenium 0.851 0.683–0.060 0.149 0.839 0.672–0.049 0.124 Zinc 0.850 0.682–0.059 0.147 0.831 0.665–0.039 0.104 Amino acids Phenylalanine 0.916 0.736–0.139 0.430 0.934 0.743–0.173 0.555 Alanine 0.850 0.682–0.059 0.147 0.864 0.686–0.088 0.213 Methionine 0.797* 0.639–0.996 0.046 0.811 0.643–0.023 0.077 Glycine 0.871 0.700–0.085 0.218 0.891 0.708–0.121 0.324 Glutamic 0.939 0.755–0.168 0.570 0.953 0.759–0.195 0.675 Cystine 0.986 0.793–0.226 0.902 0.995 0.797–0.243 0.965 Arginine 0.882 0.709–0.098 0.262 0.893 0.711–0.121 0.327 Lysine 0.818 0.656–0.020 0.075 0.834 0.661–0.053 0.127 Tyrosine 0.860 0.691–0.072 0.180 0.873 0.693–0.100 0.249 Leucine 0.939 0.755–0.168 0.570 0.967 0.770–0.215 0.775 Proline 0.974 0.784–0.211 0.815 0.990 0.790–0.240 0.929 Tryptophan 0.939 0.755–0.168 0.570 0.960 0.765–0.206 0.728 Serine 0.871 0.700–0.085 0.218 0.883 0.702–0.110 0.286 Threonine 0.905 0.727–0.125 0.368 0.924 0.735–0.162 0.501 Aspartic 0.85 0.682–0.059 0.147 0.858 0.681–0.082 0.195 Valine 0.916 0.736–0.139 0.430 0.937 0.746–0.177 0.574 Lsoleucine 0.905 0.727–0.125 0.368 0.918 0.732–0.153 0.462 Histidine 0.882 0.709–0.098 0.262 0.903 0.718–0.137 0.386 CI, confidence interval; OR, odds ratio; Crude has not been adjusted by any potential factors; Model 1 has been adjusted by age, gender and body mass index; *P < 0.05 or **P < 0.01.
下载: 导出CSV
Table 5. Receiver operator characteristic analysis between nutrient density and hypertension
AUC (95% CI) Best cutoff Sensitivity (%) Specificity (%) Maximum of Youden index* Protein Protein 0.549 (0.471–0.628) 0.059 63.20 50.90 0.14 Model of Protein# 0.600 (0.521–0.679) 0.075 40.40 81.10 0.22 Vitamins vitamin A 0.605 (0.526–0.685) 0.079 42.10 76.20 0.18 Model of vitamin A# 0.643 (0.559–0.727) 0.062 66.70 62.10 0.29 Nicotinic acid 0.657 (0.583–0.730) 0.088 49.10 76.60 0.26 Model of Nicotinic acid# 0.684 (0.612–0.756) 0.067 68.40 66.40 0.35 Minerals Lodine 0.582 (0.507–0.657) 0.058 61.40 50.80 0.12 Model of Iodine# 0.628 (0.552–0.704) 0.060 61.40 59.20 0.21 Phosphorus 0.577 (0.501–0.654) 0.074 36.80 75.80 0.13 Model of Phosphorus# 0.619 (0.544–0.694) 0.044 89.50 30.70 0.20 Selenium 0.600 (0.528–0.673) 0.057 70.20 51.30 0.22 Model of Selenium# 0.636 (0.563–0.709) 0.054 77.20 51.00 0.28 Zinc 0.615 (0.537–0.692) 0.080 43.90 76.30 0.20 Model of Zinc# 0.657 (0.584–0.729) 0.062 64.90 61.40 0.26 Amino acids Methionine 0.596 (0.523–0.669) 0.057 64.90 51.00 0.16 Model of Methionine# 0.632 (0.560–0.705) 0.051 75.40 46.80 0.22 Arginine 0.587 (0.519–0.654) 0.058 64.90 51.00 0.16 Model of Arginine# 0.625 (0.552–0.699) 0.051 75.40 46.50 0.22 Lysine 0.605 (0.535–0.676) 0.057 68.40 51.20 0.20 Model of Lysine# 0.636 (0.562–0.709) 0.051 75.40 48.00 0.23 Aspartic acid 0.596 (0.527–0.665) 0.057 68.40 51.20 0.20 Model of Aspartic acid# 0.632 (0.560–0.705) 0.051 73.70 47.30 0.21 AUC, area under the curve; CI, confidence interval; * Sensitivity + specificity?1; # Model has been adjusted by age, gender and body mass index.
下载: 导出CSV
Table 6. Receiver operator characteristic analysis between nutrient density and coronary heart disease
AUC (95% CI) Best cutoff Sensitivity (%) Specificity (%) Maximum of Youden index* Vitamins Nicotinic acid 0.597 (0.527?.667) 0.090 40.00 76.30 0.16 Model of Nicotinic acid# 0.623 (0.553?.693) 0.067 68.60 53.70 0.22 Minerals Lodine 0.589 (0.519?.658) 0.090 38.60 76.00 0.15 Model 1 of Iodine# 0.609 (0.540?.678) 0.060 72.90 45.60 0.19 AUC, area under the curve; CI, confidence interval; * Sensitivity + specificity?1; # Model has been adjusted by age, gender and body mass index.
下载: 导出CSV
-
[1] Report on Cardiovascular Health and Diseases in China 2021: An Updated Summary. BES, 2022; 35 (7): 573-603. [2] Report on Cardiovascular Health and Diseases in China 2022: Key points interpretation. Chin J Cardiovasc Sci, 2023; 28 (4): 297-312. (In Chinese) [3] Zhai F Y, Du S F, Wang Z H, et al. Dynamics of the Chinese diet and the role of urbanicity, 1991-2011. Obes Rev, 2014; 15 Suppl 1 (1): 16-26. doi: 10.1111/obr.12124 [4] Ng S W, Norton E C, Popkin B M. Why have physical activity levels declined among Chinese adults? Findings from the 1991-2006 China health and nutrition surveys. Soc Sci Med, 2009; 68 (7): 1305-1314. doi: 10.1016/j.socscimed.2009.01.035 [5] Mi Y J, Zhang B, Wang H J, et al. Prevalence and secular trends in obesity among Chinese adults, 1991-2011. Am J Prev Med, 2015; 49 (5): 661-669. doi: 10.1016/j.amepre.2015.05.005 [6] Du S, Batis C, Wang H, et al. Understanding the patterns and trends of sodium intake, potassium intake, and sodium to potassium ratio and their effect on hypertension in China. Am J Clin Nutr, 2014; 99 (2): 334-343. doi: 10.3945/ajcn.113.059121 [7] Wang C, Zhang Z, Zhou M, et al. Nonlinear relationship between extreme temperature and mortality in different temperature zones: A systematic study of 122 communities across the mainland of China. Sci Total Environ, 2017; 586: 96-106. doi: 10.1016/j.scitotenv.2017.01.218 [8] Wang M, Huang Y, Song Y, et al. Study on environmental and lifestyle factors for the north-south differential of cardiovascular disease in China. Front Public Health, 2021; 9: 615152. doi: 10.3389/fpubh.2021.615152 [9] Anderson C A, Appel L J, Okuda N, et al. Dietary sources of sodium in China, Japan, the United Kingdom, and the United States, women and men aged 40 to 59 years: the INTERMAP study. J Am Diet Assoc, 2010; 110 (5): 736-745. doi: 10.1016/j.jada.2010.02.007 [10] Wu Z, Yao C, Zhao D, et al. Multiprovincial monitoring of the trends and determinants of cardiovascular diseases (Sino-MONCA project)--IIl. Association between risk factor levels and cardiovascular disease. Lung and Blood Vessel Medical Center, 1998 (2): 5-8. (In Chinese) [11] PRC National Blood Pressure Survey Cooperative Group. Prevalence and development trends of hypertension in China. Chinese Journal of Hypertension, 1995 (S1): 9-15. (In Chinese) [12] Guo P, Zhu H, Pan H, et al. Dose-response relationships between dairy intake and chronic metabolic diseases in a Chinese population. J Diabetes, 2019; 11 (11): 846-856. doi: 10.1111/1753-0407.12921 [13] Guzik T J, Touyz R M. Oxidative stress, inflammation, and vascular aging in hypertension. Hypertension, 2017; 70 (4): 660-667. doi: 10.1161/HYPERTENSIONAHA.117.07802 [14] Loperena R, Harrison D G. Oxidative stress and hypertensive diseases. Med Clin North Am, 2017; 101 (1): 169-193. doi: 10.1016/j.mcna.2016.08.004 [15] Ross R. The pathogenesis of atherosclerosis: a perspective for the 1990s. Nature, 1993; 362 (6423): 801-809. doi: 10.1038/362801a0 [16] Fuster V, Badimon L, Badimon J J, et al. The pathogenesis of coronary artery disease and the acute coronary syndromes (2). N Engl J Med, 1992; 326 (5): 310-318. doi: 10.1056/NEJM199201303260506 [17] Achan V, Tran C T, Arrigoni F, et al. all-trans-Retinoic acid increases nitric oxide synthesis by endothelial cells: a role for the induction of dimethylarginine dimethylaminohydrolase. Circ Res, 2002; 90 (7): 764-769. doi: 10.1161/01.RES.0000014450.40853.2B [18] Jialal I, Norkus E P, Cristol L, et al. beta-Carotene inhibits the oxidative modification of low-density lipoprotein. Biochim Biophys Acta, 1991; 1086 (1): 134-138. doi: 10.1016/0005-2760(91)90164-D [19] Reifen R. Vitamin A as an anti-inflammatory agent. Proc Nutr Soc, 2002; 61 (3): 397-400. doi: 10.1079/PNS2002172 [20] Wiedermann U, Chen X J, Enerbäck L, et al. Vitamin A deficiency increases inflammatory responses. Scand J Immunol, 1996; 44 (6): 578-584. doi: 10.1046/j.1365-3083.1996.d01-351.x [21] Sahebkar A. Effect of niacin on endothelial function: a systematic review and meta-analysis of randomized controlled trials. Vasc Med, 2014; 19 (1): 54-66. doi: 10.1177/1358863X13515766 [22] Wu B J, Yan L, Charlton F, et al. Evidence that niacin inhibits acute vascular inflammation and improves endothelial dysfunction independent of changes in plasma lipids. Arterioscler Thromb Vasc Biol, 2010; 30 (5): 968-975. doi: 10.1161/ATVBAHA.109.201129 [23] Zeman M, Vecka M, Perlík F, et al. Pleiotropic effects of niacin: Current possibilities for its clinical use. Acta Pharm, 2016; 66 (4): 449-469. doi: 10.1515/acph-2016-0043 [24] Thoenes M, Oguchi A, Nagamia S, et al. The effects of extended-release niacin on carotid intimal media thickness, endothelial function and inflammatory markers in patients with the metabolic syndrome. Int J Clin Pract, 2007; 61 (11): 1942-1948. doi: 10.1111/j.1742-1241.2007.01597.x [25] Kuvin J T, Dave D M, Sliney K A, et al. Effects of extended-release niacin on lipoprotein particle size, distribution, and inflammatory markers in patients with coronary artery disease. Am J Cardiol, 2006; 98 (6): 743-745. doi: 10.1016/j.amjcard.2006.04.011 [26] Tavintharan S, Kashyap M L. The benefits of niacin in atherosclerosis. Curr Atheroscler Rep, 2001; 3 (1): 74-82. doi: 10.1007/s11883-001-0014-y [27] Rust P, Ekmekcioglu C. Impact of salt intake on the pathogenesis and treatment of hypertension. Adv Exp Med Biol, 2017; 956: 61-84. doi: 10.1007/5584_2016_147 [28] Yadav K, Pandav C S. National iodine deficiency disorders control programme: Current status & future strategy. Indian J Med Res, 2018; 148 (5): 503-510. doi: 10.4103/ijmr.IJMR_1717_18 [29] Liu J, Liu L, Jia Q, et al. Effects of excessive iodine intake on blood glucose, blood pressure, and blood lipids in adults. Biol Trace Elem Res, 2019; 192 (2): 136-144. doi: 10.1007/s12011-019-01668-9 [30] Bindels R J, Van Den Broek L A, Hillebrand S J, et al. A high phosphate diet lowers blood pressure in spontaneously hypertensive rats. Hypertension, 1987; 9 (1): 96-102. doi: 10.1161/01.HYP.9.1.96 [31] Felsenfeld A J, Rodriguez M. Phosphorus, regulation of plasma calcium, and secondary hyperparathyroidism: a hypothesis to integrate a historical and modern perspective. J Am Soc Nephrol, 1999; 10 (4): 878-890. doi: 10.1681/ASN.V104878 [32] Elliott P, Kesteloot H, Appel L J, et al. Dietary phosphorus and blood pressure: international study of macro- and micro-nutrients and blood pressure. Hypertension, 2008; 51 (3): 669-675. doi: 10.1161/HYPERTENSIONAHA.107.103747 [33] Resnick L M. The role of dietary calcium in hypertension: a hierarchical overview. Am J Hypertens, 1999; 12 (1 Pt 1): 99-112. doi: 10.1016/S0895-7061(98)00275-1 [34] Das U N. Nutritional factors in the pathobiology of human essential hypertension. Nutrition, 2001; 17 (4): 337-346. doi: 10.1016/S0899-9007(00)00586-4 [35] Nawrot T S, Staessen J A, Roels H A, et al. Blood pressure and blood selenium: a cross-sectional and longitudinal population study. Eur Heart J, 2007; 28 (5): 628-633. doi: 10.1093/eurheartj/ehl479 [36] Hu X F, Eccles K M, Chan H M. High selenium exposure lowers the odds ratios for hypertension, stroke, and myocardial infarction associated with mercury exposure among Inuit in Canada. Environ Int, 2017; 102: 200-206. doi: 10.1016/j.envint.2017.03.002 [37] Kim J. Dietary zinc intake is inversely associated with systolic blood pressure in young obese women. Nutr Res Pract, 2013; 7 (5): 380-384. doi: 10.4162/nrp.2013.7.5.380 [38] Kasai M, Miyazaki T, Takenaka T, et al. Excessive zinc intake increases systemic blood pressure and reduces renal blood flow via kidney angiotensin Ⅱ in rats. Biol Trace Elem Res, 2012; 150 (1-3): 285-290. doi: 10.1007/s12011-012-9472-z [39] Bergomi M, Rovesti S, Vinceti M, et al. Zinc and copper status and blood pressure. J Trace Elem Med Biol, 1997; 11 (3): 166-169. doi: 10.1016/S0946-672X(97)80047-8 [40] Williams C R, Mistry M, Cheriyan A M, et al. Zinc deficiency induces hypertension by promoting renal Na (+) reabsorption. Am J Physiol Renal Physiol, 2019; 316 (4): F646-F653. doi: 10.1152/ajprenal.00487.2018 [41] Altorf-Van Der Kuil W, Engberink M F, Brink E J, et al. Dietary protein and blood pressure: a systematic review. PLoS One, 2010; 5 (8): e12102. doi: 10.1371/journal.pone.0012102 [42] Robin S, Maupoil V, Groubatch F, et al. Effect of a methionine-supplemented diet on the blood pressure of Wistar-Kyoto and spontaneously hypertensive rats. Br J Nutr, 2003; 89 (4): 539-548. doi: 10.1079/BJN2002810 [43] Ditscheid B, Fünfstück R, Busch M, et al. Effect of L-methionine supplementation on plasma homocysteine and other free amino acids: a placebo-controlled double-blind cross-over study. Eur J Clin Nutr, 2005; 59 (6): 768-775. doi: 10.1038/sj.ejcn.1602138 [44] Raghavan S A, Dikshit M. Vascular regulation by the L-arginine metabolites, nitric oxide and agmatine. Pharmacol Res, 2004; 49 (5): 397-414. doi: 10.1016/j.phrs.2003.10.008 [45] Altorf-Van Der Kuil W, Engberink M F, De Neve M, et al. Dietary amino acids and the risk of hypertension in a Dutch older population: the Rotterdam Study. Am J Clin Nutr, 2013; 97 (2): 403-410. doi: 10.3945/ajcn.112.038737 [46] Rinschen M, Palygin O, Golosova D, et al. Accelerated lysine metabolism conveys kidney protection in salt-sensitive hypertension. Nat Commun, 2022; 13 (1): 4099. doi: 10.1038/s41467-022-31670-0 [47] Hou E, Sun N, Zhang F, et al. Malate and Aspartate Increase L-Arginine and Nitric Oxide and Attenuate Hypertension. Cell Rep, 2017; 19 (8): 1631-1639. doi: 10.1016/j.celrep.2017.04.071 -
 fzm-4-1-1_ESM.pdf

-

 点击查看大图

计量
- 文章访问数: 1149
- HTML全文浏览量: 829
- PDF下载量: 51
- 被引次数: 0

