 投稿系统
投稿系统

Machine learning-based prediction of 5-year survival in diffuse-type gastric cancer patients from Harbin
doi: 10.1515/fzm-2026-0004
-
Abstract:
Objective Globally, over 1.1 million new cases of gastric cancer (GC) were diagnosed in 2020, with approximately 800, 000 related deaths. GC exhibits significant regional variability, particularly in extremely cold regions, where unique climate conditions and lifestyle factors may impact disease progression and prognosis. This study aimed to predict the 5-year all-cause mortality of patients with diffuse gastric cancer (DGC) living in such regions using multiple machine learning algorithms. Methods We retrospectively analyzed 249 DGC cases and developed six machine learning models—extreme gradient boosting (XGBoost), logistic regression, decision tree, support vector machine, k-nearest neighbors, and random forest. Model performance was assessed using the area under the receiver operating characteristic curve (AUC), precision-recall curve, F1 score, and Brier score. Results The XGBoost model achieved the highest F1 scores (0.830 and 0.781, respectively) and the second-best Brier score (0.172). Conclusion This study highlights the potential of machine learning approaches to enhance prognostic assessment in GC. Although limited by single-center data and the absence of multi-center external validation, the results offer valuable insights that may inform future research and guide risk-stratified management strategies in extremely cold regions. -
Key words:
- gastric cancer /
- XGBoost /
- cold region
-

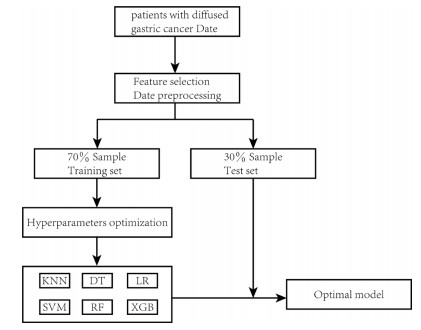
Figure 1. Flow chart for the development, explanation and validation of models KNN, k-nearest neighbors; DT, decision tree; LR, logistic regression; SVM, support vector machine; RF, random forest; XGB, extreme gradient boosting.

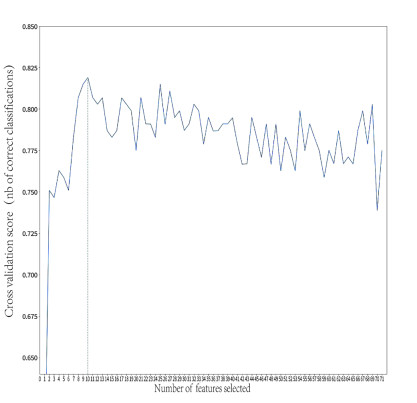
Figure 2. Results of feature screening using recursive feature elimination with 10-fold cross-validation

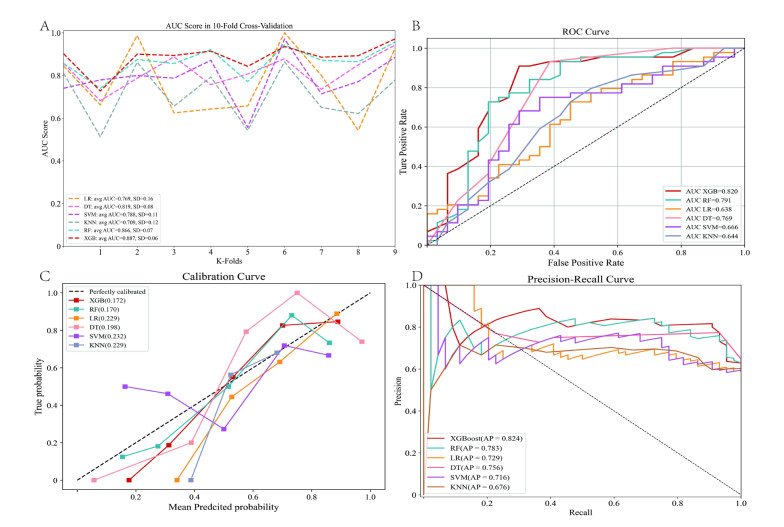
Figure 3. Comparison of model performance across six machine learning algorithms.
Receiver operating characteristic (ROC) curves for the training set (A) and test sets (B), calibration curves for the test set (C), and precision-recall curves for the test set (D).

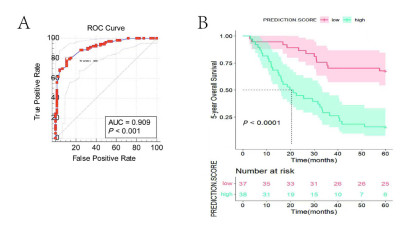
Figure 4. Machine learning-based risk prediction model analysis
(A) Optimal categorization threshold derived from prediction score; (B) KaplanMeier survival curves for patients classified into low-risk and high-risk groups based on the machine learning model.
Table 1. Baseline demographics and clinical characteristics of the study population
Characteristics Level Overall (N = 249) Test set (N = 75) Training set (N = 174) P value Status 1.000 Survival 103 (41.4) 31 (41.3) 72 (41.4) Death 146 (58.6) 44 (58.7) 102 (58.6) Sex 0.422 Female 144 (57.8) 40 (53.3) 104 (59.8) Male 105 (42.2) 35 (46.7) 70 (40.2) Radical Yes 194 (77.9) 59 (78.7) 135 (77.6) 0.982 No 55 (22.1) 16 (21.3) 39 (22.4) pT T1 8 (3.2) 4 (5.3) 4 (2.3) 0.527 T2 19 (7.6) 5 (6.7) 14 (8.0) T3 133 (53.4) 37 (49.3) 96 (55.2) T4 89 (35.7) 29 (38.7) 60 (34.5) pN N1 51 (20.5) 15 (20.0) 36 (20.7) 0.452 N2 51 (20.5) 13 (17.3) 38 (21.8) N3a 105 (42.2) 37 (49.3) 68 (39.1) N3b 42 (16.9) 10 (13.3) 32 (18.4) pTNM Ⅰ 17 (6.8) 5 (6.7) 12 (6.9) 0.916 Ⅱ 67 (26.9) 18 (24.0) 49 (28.2) Ⅲ 153 (61.4) 48 (64.0) 105 (60.3) Ⅳ 12 (4.8) 4 (5.3) 8 (4.6) Borrmann 0 6 (2.4) 2 (2.7) 4 (2.3) 0.431 Ⅰ 2 (0.8) 0 (0.0) 2 (1.1) Ⅱ 42 (16.9) 9 (12.0) 33 (19.0) Ⅲ 128 (51.4) 44 (58.7) 84 (48.3) Ⅳ 59 (23.7) 15 (20.0) 44 (25.3) Ⅴ 12 (4.8) 5 (6.7) 7 (4.0) WHO Classification Well-to-moderate differentiated 3 (1.2) 1 (1.3) 2 (1.1) 0.913 Poorly differentiated 24 (9.6) 6 (8.0) 18 (10.3) Signet-ring cell 14 (5.6) 5 (6.7) 9 (5.2) Mucinous 208 (83.5) 63 (84.0) 145 (83.3) Location Upper stomach 16 (6.4) 9 (12.0) 7 (4.0) 0.005 Middle stomach 55 (22.1) 8 (10.7) 47 (27.0) Lower stomach 133 (53.4) 46 (61.3) 87 (50.0) Whole stomach 45 (18.1) 12 (16.0) 33 (19.0) Tumor Size (mm) 50.00 (35.00, 60.00) 50.00 (35.00, 60.00) 50.00 (35.00, 70.00) 0.423 Age (years) 54.00 (46.00, 61.00) 56.00 (46.00, 60.00) 54.00 (46.00, 62.00) 0.990 WBC (× 109/L) 6.31 (5.21, 7.75) 6.27 (5.23, 7.58) 6.31 (5.22, 8.05) 0.776 LYM (× 109/L) 1.82 (1.44, 2.27) 1.82 (1.47, 2.24) 1.83 (1.42, 2.28) 0.898 NEU (× 109/L) 3.76 (2.78, 4.84) 3.55 (2.77, 4.42) 3.84 (2.81, 5.00) 0.306 MONO (× 109/L) 0.46 (0.35, 0.61) 0.47 (0.36, 0.62) 0.46 (0.35, 0.60) 0.596 EOS (× 109/L) 0.11 (0.06, 0.20) 0.12 (0.08, 0.24) 0.11 (0.06, 0.19) 0.059 BASO (× 109/L) 0.02 (0.01, 0.04) 0.02 (0.01, 0.04) 0.02 (0.01, 0.04) 0.634 RBC (× 1012/L) 4.37 (4.03, 4.74) 4.35 (3.93, 4.71) 4.38 (4.06, 4.76) 0.583 HGB (g/L) 131.00 (110.00, 144.00) 132.70 (109.00, 143.00) 130.95 (111.00, 144.15) 0.916 HCT (%) 39.92 (34.80, 43.30) 40.42 (34.82, 43.81) 39.64 (34.60, 43.09) 0.912 MCV (fL) 90.80 (85.70, 94.10) 90.80 (86.50, 94.40) 90.60 (85.70, 93.80) 0.543 MCH (pg) 30.00 (28.00, 31.30) 29.90 (28.50, 31.30) 30.20 (27.90, 31.30) 0.706 MCHC (g/L) 327.00 (319.00, 335.00) 327.00 (319.00, 334.00) 327.00 (318.25, 335.00) 0.954 RDW (%) 13.20 (12.70, 14.20) 13.20 (12.65, 14.10) 13.20 (12.70, 14.20) 0.876 PLT (× 109/L) 259.00 (211.00, 310.00) 272.00 (205.50, 329.50) 252.50 (213.00, 306.25) 0.498 MPV (fL) 9.70 (8.60, 10.50) 9.60 (8.60, 10.50) 9.70 (8.70, 10.50) 0.429 PDW (%) 15.90 (12.20, 16.50) 15.90 (12.95, 16.55) 15.90 (11.90, 16.50) 0.650 PCT (%) 0.25 (0.20, 0.31) 0.25 (0.20, 0.32) 0.25 (0.20, 0.30) 0.773 ALT (U/L) 17.00 (13.00, 24.00) 16.00 (12.50, 20.70) 17.00 (13.00, 25.00) 0.182 AST (U/L) 20.00 (17.00, 25.00) 20.00 (17.00, 24.00) 20.00 (17.00, 26.00) 0.480 γ-GGT (U/L) 15.50 (10.00, 24.00) 15.00 (9.00, 21.50) 16.00 (11.00, 24.00) 0.198 LDH (U/L) 158.00 (138.00, 177.00) 163.00 (143.50, 180.50) 155.50 (135.00, 173.00) 0.036 ALP (U/L) 73.00 (58.00, 87.00) 70.00 (54.00, 85.50) 74.50 (59.25, 87.00) 0.189 TBIL (μmol/L) 10.75 (7.90, 14.27) 12.06 (7.86, 14.85) 10.57 (7.93, 14.02) 0.275 DBIL (μmol) 3.90 (2.85, 5.07) 4.23 (3.06, 5.24) 3.83 (2.76, 4.97) 0.133 IDBIL (μmol/L) 6.92 (4.79, 9.36) 7.57 (5.03, 9.75) 6.65 (4.82, 8.89) 0.391 TP (g/L) 67.00 (63.00, 71.00) 66.00 (62.50, 71.00) 67.00 (63.00, 71.75) 0.474 ALB (g/L) 41.00 (37.00, 44.00) 41.00 (38.00, 44.00) 40.05 (37.00, 44.00) 0.609 GLOB (g/L) 26.00 (23.00, 29.00) 25.00 (22.00, 27.50) 26.00 (24.00, 29.00) 0.083 A/G 1.60 (1.40, 1.80) 1.60 (1.40, 1.80) 1.60 (1.40, 1.70) 0.220 PALB (mg/L) 241.00 (197.00, 285.00) 248.00 (196.00, 288.50) 239.00 (200.25, 282.00) 0.661 GLU (mmol/L) 5.00 (4.60, 5.50) 5.00 (4.50, 5.40) 4.95 (4.60, 5.57) 0.890 UREA (mmol/L) 5.30 (4.30, 6.40) 5.30 (3.90, 6.30) 5.35 (4.40, 6.50) 0.132 CREA (mmol/L) 75.00 (65.00, 84.00) 73.00 (63.00, 82.00) 76.00 (65.15, 85.00) 0.167 UA (mmol/L) 270.00 (227.00, 332.00) 264.00 (210.00, 314.50) 274.50 (234.00, 337.75) 0.123 CO2. CP (mmol/L) 28.70 (26.50, 30.40) 28.60 (27.20, 30.30) 28.75 (26.22, 30.48) 0.870 K (mmol/L) 4.27 (4.00, 4.49) 4.30 (4.04, 4.50) 4.24 (4.00, 4.47) 0.249 Na (mmol/L) 141.00 (139.00, 144.00) 142.00 (139.50, 143.50) 141.00 (139.00, 144.00) 0.840 CL (mmol/L) 104.00 (101.00, 106.00) 104.00 (101.00, 107.00) 104.00 (101.00, 106.00) 0.700 Ca (mmol/L) 2.30 (2.20, 2.40) 2.20 (2.10, 2.40) 2.30 (2.20, 2.40) 0.278 PHOS (mmol/L) 1.16 (1.05, 1.28) 1.18 (1.06, 1.31) 1.15 (1.05, 1.27) 0.272 Mg (mmol/L) 0.96 (0.11) 0.95 (0.11) 0.97 (0.11) 0.478 CA199 (U/mL) 9.12 (6.01, 17.95) 9.97 (6.34, 21.20) 8.84 (5.83, 16.27) 0.296 CEA (ng/mL) 1.63 (0.90, 2.93) 1.95 (1.00, 2.79) 1.54 (0.83, 3.04) 0.295 CA724 (U/mL) 2.47 (1.30, 6.72) 2.15 (1.29, 6.40) 2.74 (1.32, 7.85) 0.364 CA125 (U/mL) 10.51 (7.92, 15.70) 10.88 (8.03, 15.23) 10.18 (7.73, 15.75) 0.621 PH 6.00 (5.50, 6.50) 6.00 (5.50, 6.50) 6.00 (5.50, 6.50) 0.579 SG 1.02 (1.02, 1.03) 1.02 (1.01, 1.02) 1.02 (1.02, 1.03) 0.038 Weight (kg) 62.00 (55.00, 70.00) 60.00 (55.00, 68.00) 64.00 (55.00, 70.00) 0.427 Height (cm) 166.00 (160.00, 172.00) 166.00 (160.00, 171.50) 166.50 (160.00, 173.00) 0.394 Data were presented as N(%) or median (IQR). pT, pathological T stage; pN, pathological N stage; pTNM, pathological tumor-node-metastasis stage; WBC, white blood cell; LYM, lymphocyte; NEU, neutrophil; MONO, monocyte; EOS, eosinophil; BASO, basophil; RBC, red blood cell; HGB, hemoglobin; HCT, hematocrit; MCV, mean corpuscular volume; MCH, mean corpuscular hemoglobin; MCHC, mean corpuscular hemoglobin concentration; RDW, red cell distribution width; PLT, platelet; MPV, mean platelet volume; PDW, platelet distribution width; PCT, plateletcrit; ALT, alanine aminotransferase; AST, aspartate aminotransgerase; γ-GGT, gamma-glutamyl transferase; LDH, lactate dehydrogenase; ALP, alkaline phosphatase; TBIL, total bilirubin; DBIL, direct bilirubin; IDBIL, indirect bilirubin; TP, total protein; ALB, albumin; GLOB, globulin; A/G, albumin/globulin ratio; PALB, prealbumin; GLU, gulcose; CREA, creatinine; UA, uric acid; CO2. CP, carbon dioxide combining power; K, potassium; Na, sodium; CL, cholride; Ca, calcium; PHOS, phosphorus; Mg, magnesium; CA199, carbohydrate antigen19-9; CEA, carcinoembryonic antigen; CA724, carbohydrate antigen 72-4; CA125, carbohydrate antigen 125; SG, specific gravity.  下载: 导出CSV
Table 2. Predictive performance of different machine learning models in the test set
Models AUC (95% CI) Accuracy F1 Score Brier Score DT 0.769 (0.752-0.787) 0.800 0.781 0.198 (0.191-0.206) LR 0.638 (0.62-0.653) 0.618 0.498 0.229 (0.226-0.233) KNN 0.644 (0.625-0.662) 0.667 0.641 0.229 (0.226-0.232) SVM 0.666 (0.649-0.681) 0.640 0.630 0.232 (0.225-0.238) RF 0.791 (0.749-0.778) 0.747 0.727 0.170 (0.163-0.176) XGB 0.820 (0.805-0.833) 0.800 0.781 0.172 (0.166-0.177) AUC, area under the receiver operating characteristic curve, DT, decision tree, SVM, support vector machine, KNN, k-nearest neighbors, LR, logistic regression, RF, random forest, XGB, extreme gradient boosting.
下载: 导出CSV
Table 3. Predictive performance of different machine learning models in the training set using 10-fold cross-validation
Models AUC Accuracy F1 Score Brier score DT 0.819 ± 0.075 0.788 ± 0.089 0.831 ± 0.063 0.165 ± 0.042 SVM 0.788 ± 0.106 0.718 ± 0.088 0.750 ± 0.092 0.188 ± 0.034 KNN 0.709 ± 0.122 0.625 ± 0.115 0.649 ± 0.128 0.221 ± 0.020 LR 0.769 ± 0.156 0.717 ± 0.117 0.791 ± 0.085 0.208 ± 0.038 RF 0.866 ± 0.065 0.811 ± 0.079 0.851 ± 0.059 0.149 ± 0.030 XGB 0.887 ± 0.062 0.789 ± 0.097 0.829 ± 0.074 0.152 ± 0.024 Data were presented as mean ± SD; AUC, area under the receiver operating characteristic curve, DT, decision tree, SVM, support vector machine, KNN, k-nearest neighbors, LR, logistic regression, RF, random forest, XGB, extreme gradient boosting.
下载: 导出CSV
-
[1] No authors listed. Erratum: Global cancer statistics 2018: GLOBOCAN estimates of incidence and mortality worldwide for 36 cancers in 185 countries. CA Cancer J Clin, 2020; 70(4): 313. [2] Brenner H, Rothenbacher D, Arndt V. Epidemiology of stomach cancer. Methods Mol Biol, 2009; 472: 467-477. [3] Thrift A P, Wenker T N, El-Serag H B. Global burden of gastric cancer: epidemiological trends, risk factors, screening and prevention. Nat Rev Clin Oncol, 2023; 20(5): 338-349. [4] Hartgrink H H, van de Velde C J, Putter H, et al. Extended lymph node dissection for gastric cancer: who may benefit? Final results of the randomized Dutch gastric cancer group trial. J Clin Oncol, 2004; 22(11): 2069-2077. [5] Kinoshita T, Uyama I, Terashima M, et al. Long-term outcomes of laparoscopic versus open surgery for clinical stage Ⅱ/Ⅲ gastric cancer: a multicenter cohort study in Japan (LOC-A Study). Ann Surg, 2019; 269(5): 887-894. [6] Liu F, Huang C, Xu Z, et al. Morbidity and mortality of laparoscopic vs open total gastrectomy for clinical stage i gastric cancer: the CLASS02 multicenter randomized clinical trial. JAMA Oncol, 2020; 6(10): 1590-1597. [7] Siegel R L, Miller K D, Jemal A. Cancer statistics, 2016. CA Cancer J Clin, 2016; 66(1): 7-30. [8] Lauren P A. The two histological main types of gastric carcinoma: diffuse and so-called intestinal-type carcinoma: an attempt at a histoclinical classification. Acta Pathol Microbiol Scand, 1965; 64(1): 31-49. [9] Chen Y C, Fang W L, Wang R F, et al. Clinicopathological variation of lauren classification in gastric cancer. Pathol Oncol Res, 2016; 22(1): 197-202. [10] Qiu M Z, Cai M Y, Zhang D S, et al. Clinicopathological characteristics and prognostic analysis of Lauren classification in gastric adenocarcinoma in China. J Transl Med, 2013; 11: 58. [11] Li R, Zhang H, Cao Y, et al. Lauren classification identifies distinct prognostic value and functional status of intratumoral CD8(+) T cells in gastric cancer. Cancer Immunol Immunother, 2020; 69(7): 1327-1336. [12] Chandra R, Balachandar N, Wang S, et al. The changing face of gastric cancer: epidemiologic trends and advances in novel therapies. Cancer Gene Ther, 2021; 28(5): 390-399. [13] Richa, Sharma N, Sageena G J T M C. Dietary factors associated with gastric cancer-a review. Transl Med Commun, 2022; 7(1): 7. [14] Huang B, Liu J, Ding F, et al. Epidemiology, risk areas and macro determinants of gastric cancer: a study based on geospatial analysis. Int J Health Geogr, 2023; 22(1): 32. [15] Deo R C. Machine Learning in Medicine. Circulation, 2015; 132(20): 1920-1930. [16] Komura D, Ishikawa S. Machine learning approaches for pathologic diagnosis. Virchows Arch, 2019; 475(2): 131-138. [17] Tran N K, Albahra S, May L, et al. Evolving applications of artificial intelligence and machine learning in infectious diseases testing. Clin Chem, 2021; 68(1): 125-133. [18] Gao Y, Xin L, Lin H, et al. Machine learning-based automated sponge cytology for screening of oesophageal squamous cell carcinoma and adenocarcinoma of the oesophagogastric junction: a nationwide, multicohort, prospective study. Lancet Gastroenterol Hepatol, 2023; 8(5): 432-445. [19] AlJame M, Ahmad I, Imtiaz A, et al. Ensemble learning model for diagnosing COVID-19 from routine blood tests. Inform Med Unlocked, 2020; 21: 100449. [20] Okada S, Ohzeki M, Taguchi S. Efficient partition of integer optimization problems with one-hot encoding. Sci Rep, 2019; 9(1): 13036. [21] Yuan K C, Tsai L W, Lee K H, et al. The development an artificial intelligence algorithm for early sepsis diagnosis in the intensive care unit. Int J Med Inform, 2020; 141: 104176. [22] Nick T G, Campbell K M. Logistic regression. Methods Mol Biol, 2007; 404: 273-301. [23] Uddin S, Khan A, Hossain M E, et al. Comparing different supervised machine learning algorithms for disease prediction. BMC Med Inform Decis Mak, 2019; 19(1): 281. [24] Jiang H, Mao H, Lu H, et al. Machine learning-based models to support decision-making in emergency department triage for patients with suspected cardiovascular disease. Int J Med Inform, 2021; 145: 104326. [25] Youssef Ali Amer A. Global-local least-squares support vector machine (GLocal-LS-SVM). PLoS One, 2023; 18(4): e0285131. [26] Salvador-Meneses J, Ruiz-Chavez Z, Garcia-Rodriguez J. Compressed kNN: K-nearest neighbors with data compression. Entropy (Basel), 2019; 21(3): 234. [27] Park J C, Lee Y C, Kim J H, et al. Clinicopathological aspects and prognostic value with respect to age: an analysis of 3 362 consecutive gastric cancer patients. J Surg Oncol, 2009; 99(7): 395-401. [28] Fang C, Wang W, Deng J Y, et al. Proposal and validation of a modified staging system to improve the prognosis predictive performance of the 8th AJCC/UICC pTNM staging system for gastric adenocarcinoma: a multicenter study with external validation. Cancer Commun (Lond), 2018; 38(1): 67. [29] Wang Y, Zhang J, Guo S, et al. Implication of lymph node staging in migration and different treatment strategies for stage T2N0M0 and T1N1M0 resected gastric cancer: a SEER population analysis. Clin Transl Oncol, 2019; 21(11): 1499-1509. [30] Bang C S, Ahn J Y, Kim J H, et al. Establishing machine learning models to predict curative resection in early gastric cancer with undifferentiated histology: development and usability study. J Med Internet Res, 2021; 23(4): e25053. [31] Zhou C, Hu J, Wang Y, et al. A machine learning-based predictor for the identification of the recurrence of patients with gastric cancer after operation. Sci Rep, 2021; 11(1): 1571. [32] Zhou C, Wang Y, Ji M H, et al. Predicting peritoneal metastasis of gastric cancer patients based on machine learning. Cancer Control, 2020; 27(1): 1073274820968900. [33] Turkki R, Byckhov D, Lundin M, et al. Breast cancer outcome prediction with tumour tissue images and machine learning. Breast Cancer Res Treat, 2019; 177(1): 41-52. [34] Wentzensen N, Lahrmann B, Clarke M A, et al. Accuracy and efficiency of deep-learning-based automation of dual stain cytology in cervical cancer screening. J Natl Cancer Inst, 2021; 113(1): 72-79. [35] Gehrung M, Crispin-Ortuzar M, Berman A G, et al. Triage-driven diagnosis of Barrett's esophagus for early detection of esophageal adenocarcinoma using deep learning. Nat Med, 2021; 27(5): 833-841. [36] Wang L, Wang X, Chen A, et al. Prediction of type 2 diabetes risk and its effect evaluation based on the XGBoost model. Healthcare (Basel), 2020; 8(3): 247. [37] Filik L. Ulcer size and gastric cancer prognosis. Dig Surg, 2010; 27(3): 248-249. [38] Kemi N, Ylitalo O, Väyrynen J P, et al. Tertiary lymphoid structures and gastric cancer prognosis. Apmis, 2023; 131(1): 19-25. -

 点击查看大图
计量
- 文章访问数: 186
- HTML全文浏览量: 98
- PDF下载量: 7
- 被引次数: 0

