 投稿系统
投稿系统

Comprehensive analysis of cold exposure-associated transcriptional and metabolic changes in the liver
doi: 10.1515/fzm-2025-0024
-
Abstract:
Background Cold exposure is associated with metabolic alterations. This study aims to investigate the effects and mechanisms of cold exposure on liver metabolism through the integration of transcriptomics and metabolomics. Methods Liver tissues from mice exposed to cold were subjected to RNA sequencing and liquid chromatography-mass spectrometry (LC-MS) for transcriptomic and metabolomic profiling, respectively. Differentially expressed genes (DEGs) and differentially expressed metabolites (DEMs) were identified. mRNA expression levels were validated by real-time polymerase chain reaction (RT-PCR). Gene ontology (GO), Kyoto encyclopedia of genes and genomes (KEGG), and Reactome enrichment analyses were performed. Finally, transcriptomic and metabolomic data were integrated and analyzed. Results Cold exposure altered the transcriptomic and metabolomic profiles in the liver in cold exposed mice. Enrichment analyses were of DEGs and DEMs. Enrichment analyses of DEGs and DEMs revealed that DEGs were involved in pathways such as the PI3K-Akt signaling pathway, cytokine-cytokine receptor interaction, and cell adhesion molecules. DEMs were enriched in pathways related to membrane transport, nucleotide metabolism, and the metabolism of cofactors and vitamins. The integration of transcriptomic and metabolomic data identified several pathways potentially associated with cold exposure, such as the PI3K-Akt signaling pathway. Conclusion Cold exposure alters liver transcriptomic and metabolomic profiles in mice. The integrative analysis of transcriptomic and metabolomic data highlights the complexity of the liver's response to cold exposure and identifies potential targets for further investigation. -
Key words:
- cold exposure /
- liver metabolism /
- transcriptome /
- metabolome
-

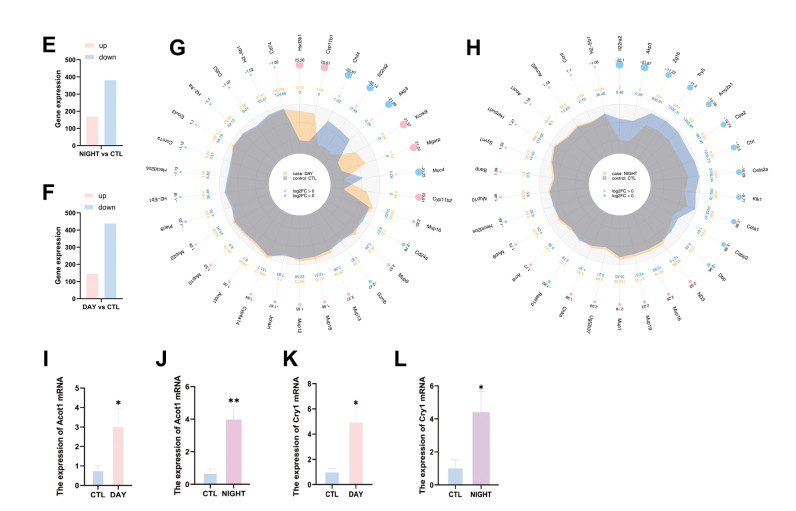
Figure 1. Cold exposure alters gene expression profiles in the mouse liver
(A) Gene expression heatmap between the control and day groups. (B) Gene expression heatmap between the control and night groups. (C) The volcano plots of differentially expressed genes between the control and day groups. (D) The volcano plots of differentially expressed genes between the control and night groups. (E) The number of DEGs between the control and night groups. (F) The number of DEGs between the control and day groups. (G) Radar Chart of differentially expressed genes between the control and day groups. (H) Radar Chart of differentially expressed genes between the control and night groups. (I) Acot1 mRNA expression in the control and day groups. (J) Acot1 mRNA expression in the control and night groups. (K) Cry1 mRNA expression in the control and day groups. (L) Cry1 mRNA expression between the control and day groups. CTL, control. *P < 0.05. **P < 0.01.

Figure 2. Enrichment analysis of differentially expressed genes (DEGs) in the mouse liver
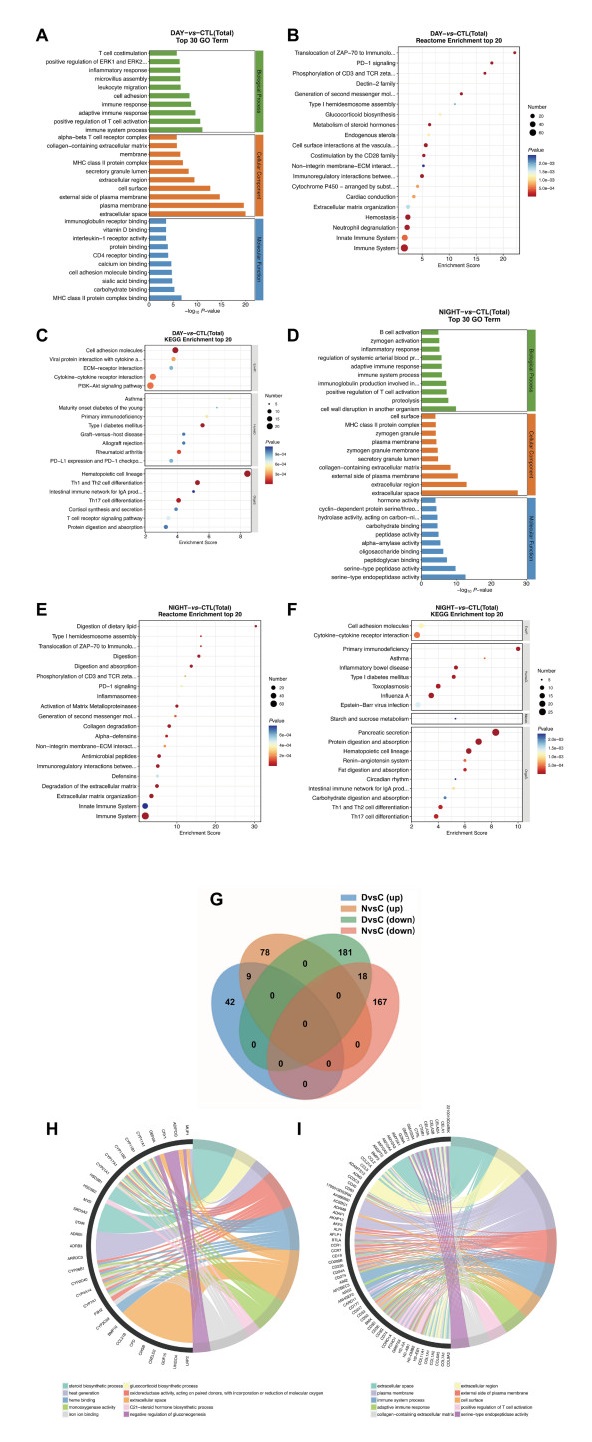
(A) The bar chart of gene ontology enrichment analysis of DEGs between the control and day groups. (B) Kyoto encyclopedia of genes and genomes (KEGG) enrichment analysis of DEGs between the control and day groups. (C) Reactome enrichment analysis of DEGs between the control and day groups. (D) GO enrichment analysis of DEGs between the control and night groups. (E) KEGG enrichment analysis of DEGs between the control and night groups. (F) Reactome enrichment analysis of DEGs between the control and night groups. (G) The overlapped DEGs across the three groups. (H) KEGG pathway of DEGs is upregulated following cold exposure. (I) KEGG pathway of DEGs is downregulated following cold exposure. CTL, control.

Figure 3. Enrichment analysis of differentially expressed metabolites (DEMs) in the mouse liver tissue
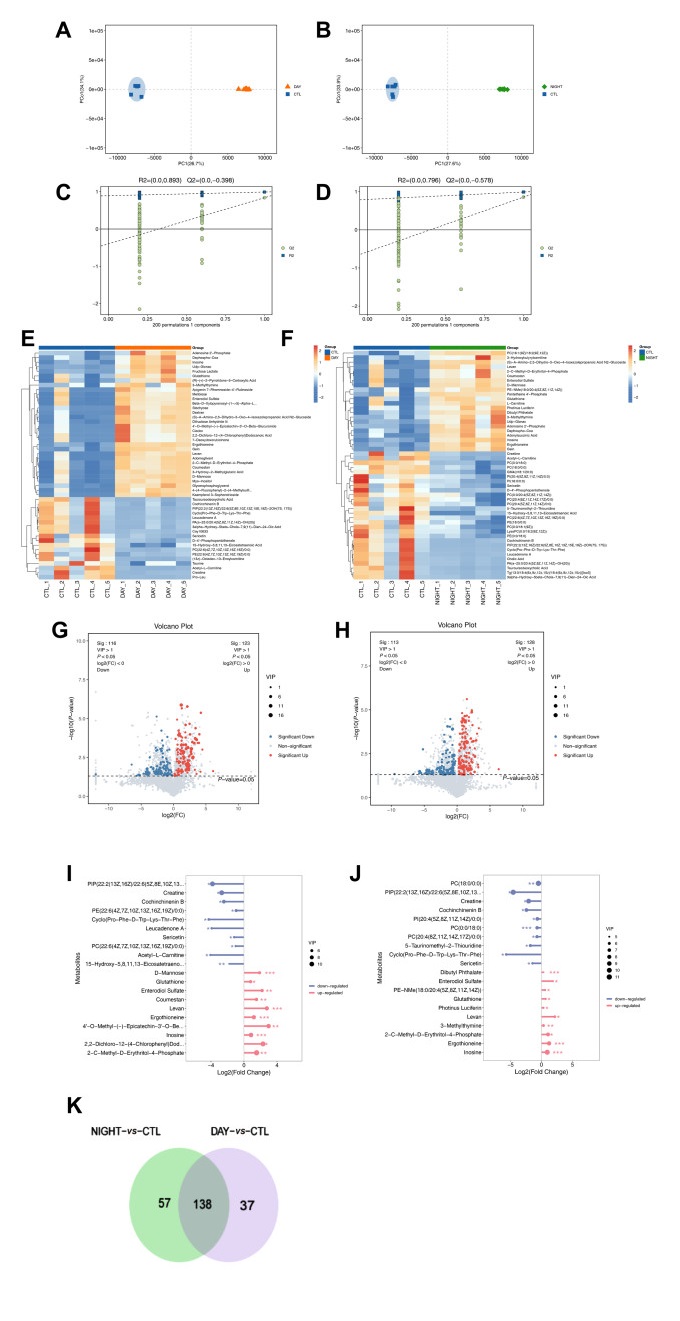
(A) Orthogonal partial least squares discriminant analysis (OPLS-DA) analysis of the cardiometabolic group between the control and day positive ion (POS) mode. (B) OPLS-DA of the cardiometabolic group between the control and night in POS mode. (C) Permutation test evaluating the accuracy of the OPLS-DA model for the control and day group. (D) Permutation test evaluating the accuracy of the OPLS-DA model for the control and night group. (E) Heatmap of DEMs between the con-trol and day groups. (F) Heatmap of DEMs between the control and night groups. (G) Volcano plots of DEMs between the control and day groups. (H) Volcano plots of DEMs between the control and night groups. (I) Lollipop chart of DEMs between the control and day groups. (J) Lollipop chart of DEMs between the control and night groups. (K) Venn diagram of DEMs across the three groups. CTL, control.

Figure 4. Enrichment analysis of the differentially expressed metabolites (DEMs) in liver of cold-exposed mice
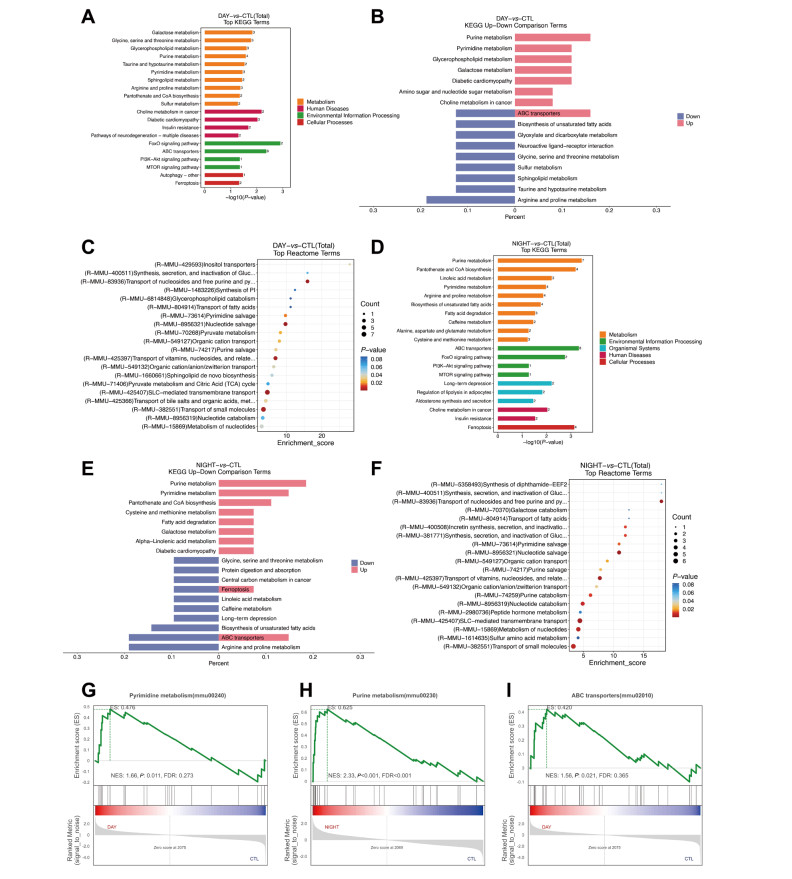
(A) KEGG enrichment analysis of DEMs between the control and day groups. (B) Kyoto encyclopedia of genes and genomes (KEGG) enrichment analysis of the upregulated and downregulated DEMs between the control and day groups. (C) Reactome enrichment analysis of DEMs between the control and day groups. (D) KEGG enrichment analysis of DEMs between the control and night groups. (E) KEGG enrichment analysis of the upregulated and downregulated DEMs between the control and night groups. (F) Reactome enrichment analysis of DEMs between the control and night groups. (G) Gene set enrichment analysis (GSEA) enrichment analysis of Purine metabolism pathway between the control and day groups. (H) GSEA enrichment analysis of Purine metabolism pathway between the control and night groups. (I) GSEA enrichment analysis of ABC transporters pathway between the control and day groups. CTL, control.

Figure 5. Combined analysis of transcriptome and metabolome
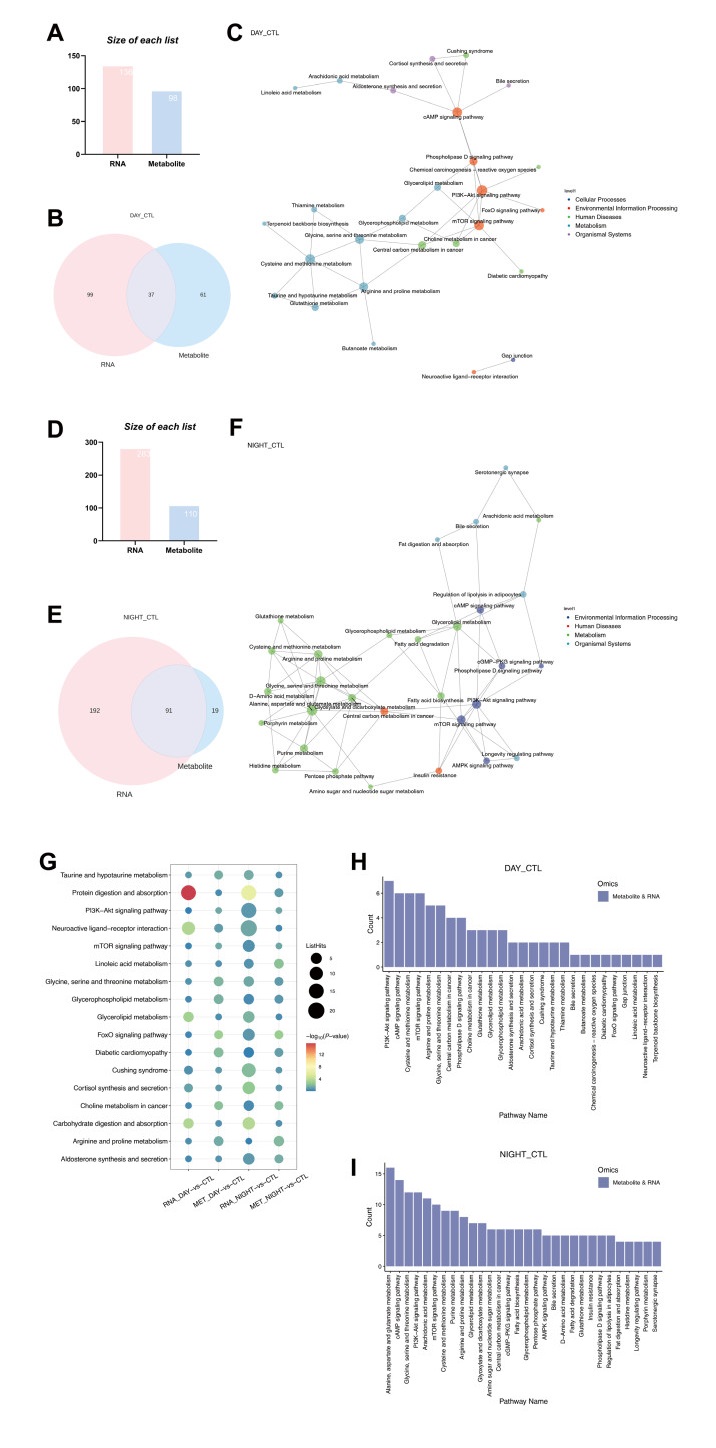
(A) Number of differentially expressed metabolites (DEMs) and differentially expressed metabolites (DEMs) between the control and day groups enriched Kyoto encyclopedia of genes and genomes (KEGG) pathways. (B) Number of overlapped KEGG pathways between the control and day groups. (C) Overlapping pathways between the control and day groups. (D) Number of DEGs and DEMs between the control and night groups enriched KEGG pathways. (E) Number of overlapping KEGG pathways between the control and night groups. (F) Overlapping pathways between the control and night groups. (G) Interaction network diagram of the overlapping pathways between the control and day groups. (H) Interaction network diagram of overlapping pathways between the control and night groups. (I) Enriched pathways associated with cold exposure. CTL, control.
-
[1] Thorne R H, Purcell A T. Environmental effects on the subjective perception of level of arousal and the human body temperature rhythm. Int J Biometeorol, 1976; 20(4): 318-324. doi: 10.1007/BF01553589 [2] Barnett A G, Sans S, Salomaa V, et al. The effect of temperature on systolic blood pressure. Blood Press Monit, 2007; 12(3): 195-203. doi: 10.1097/MBP.0b013e3280b083f4 [3] Liu S, Liu Y, Wan B, et al. Association between vitamin D status and non-alcoholic fatty liver disease: A population-based study. J Nutr Sci Vitaminol (Tokyo), 2019; 65(4): 303-308. doi: 10.3177/jnsv.65.303 [4] Yip T C, Fan J G, Wong V W. China's fatty liver crisis: A looming public health emergency. Gastroenterology, 2023; 165(4): 825-827. doi: 10.1053/j.gastro.2023.06.008 [5] Liu Y, Xue N, Zhang B, et al. Cold stress induced liver injury of mice through activated NLRP3/Caspase-1/GSDMD pyroptosis signaling pathway. Biomolecules, 2022; 12(7): 927. doi: 10.3390/biom12070927 [6] Ivanova Y M, Blondin D P. Examining the benefits of cold exposure as a therapeutic strategy for obesity and type 2 diabetes. J Appl Physiol (1985), 2021; 130(5): 1448-1459. doi: 10.1152/japplphysiol.00934.2020 [7] Costello J T, Baker P R, Minett G M, et al. Whole-body cryotherapy (extreme cold air exposure) for preventing and treating muscle soreness after exercise in adults. Cochrane Database Syst Rev, 2015; 2015(9): CD010789. doi: 10.1002/14651858.CD010789.pub2 [8] Cunningham J J, Gulino M A, Meara P A, et al. Enhanced hepatic insulin sensitivity and peripheral glucose uptake in cold acclimating rats. Endocrinology, 1985; 117(4): 1585-1589. doi: 10.1210/endo-117-4-1585 [9] Peschke D, Peschke E, Peil J, et al. Effect of ganglionectomy (superior cervical ganglia) at normal temperature and exposure to cold on the circadian rhythm of liver glycogen and blood glucose levels of the Wistar rat with regard to the pineal gland. Acta Histochem, 1986; 80(2): 159-174. doi: 10.1016/S0065-1281(86)80060-5 [10] Xu J, Cui L, Wang J, et al. Cold-activated brown fat-derived extracellular vesicle-miR-378a-3p stimulates hepatic gluconeogenesis in male mice. Nat Commun, 2023; 14(1): 5480. doi: 10.1038/s41467-023-41160-6 [11] Gong L, Zhao S, Chu X, et al. Assessment of cold exposure-induced metabolic changes in mice using untargeted metabolomics. Front Mol Biosci, 2023; 10: 1228771. doi: 10.3389/fmolb.2023.1228771 [12] Yu X X, Mao W, Zhong A, et al. Characterization of novel UCP5/BMCP1 isoforms and differential regulation of UCP4 and UCP5 expression through dietary or temperature manipulation. FASEB J, 2000; 14(11): 1611-1618. doi: 10.1096/fj.99-0834com [13] Kim D, Langmead B, Salzberg S L. HISAT: a fast spliced aligner with low memory requirements. Nat Methods, 2015; 12(4): 357-360. doi: 10.1038/nmeth.3317 [14] Huang X, Tang W, Lin C, et al. Protective mechanism of Astragalus Polysaccharides against Cantharidin-induced liver injury determined in vivo by liquid chromatography/mass spectrometry metabolomics. Basic Clin Pharmacol Toxicol, 2021; 129(1): 61-71. doi: 10.1111/bcpt.13585 [15] Ashburner M, Ball C A, Blake J A, et al. Gene ontology: tool for the unification of biology. The Gene Ontology Consortium. Nat Genet, 2000; 25(1): 25-29. doi: 10.1038/75556 [16] Kanehisa M, Araki M, Goto S, et al. KEGG for linking genomes to life and the environment. Nucleic Acids Res, 2008; 36(Database issue): D480-D484. doi: 10.1093/nar/gkm882 [17] Subramanian A, Tamayo P, Mootha V K, et al. Gene set enrichment analysis: a knowledge-based approach for interpreting genome-wide expression profiles. Proc Natl Acad Sci U S A, 2005; 102(43): 15545-15550. doi: 10.1073/pnas.0506580102 [18] Huang Y, Xiong K, Wang A, et al. Cold stress causes liver damage by inducing ferroptosis through the p38 MAPK/Drp1 pathway. Cryobiology, 2023; 113: 104563. doi: 10.1016/j.cryobiol.2023.104563 [19] Sugimoto S, Mena H A, Sansbury B E, et al. Brown adipose tissue-derived MaR2 contributes to cold-induced resolution of inflammation. Nat Metab, 2022; 4(6): 775-790. doi: 10.1038/s42255-022-00590-0 [20] Du J, He Z, Cui J, et al. Osteocyte apoptosis contributes to cold exposure-induced bone loss. Front Bioeng Biotechnol, 2021; 9: 733582. doi: 10.3389/fbioe.2021.733582 [21] Fischer A W, Cannon B, Nedergaard J. Optimal housing temperatures for mice to mimic the thermal environment of humans: An experimental study. Mol Metab, 2018; 7: 161-170. doi: 10.1016/j.molmet.2017.10.009 [22] Lelis Carvalho A, Treyball A, Brooks D J, et al. TRPM8 modulates temperature regulation in a sex-dependent manner without affecting cold-induced bone loss. PLoS One, 2021; 16(6): e0231060. doi: 10.1371/journal.pone.0231060 [23] Perepechaeva M L, Grishanova A Y. Cold-induced activities of cytochromes P450 1A1 and 1A2 in rat liver: putative role of endogenous compounds in induction mechanism. Bull Exp Biol Med, 2013; 154(5): 638-641. doi: 10.1007/s10517-013-2019-2 [24] Wang J, Chen Y, Zhang W, et al. Akt activation protects liver cells from apoptosis in rats during acute cold exposure. Int J Biol Sci, 2013; 9(5): 509-517. doi: 10.7150/ijbs.5220 [25] Yin I X, Tang H, Fang Y, et al. Hepatic transcriptome delineates the therapeutic effects of Sanren Tang on high-fat diet-induced non-alcoholic fatty liver disease. J Tradit Chin Med, 2023; 43(6): 1092-1102. [26] Dare A, Channa M L, Nadar A. L-ergothioneine and metformin alleviates liver injury in experimental type-2 diabetic rats via reduction of oxidative stress, inflammation, and hypertriglyceridemia. Can J Physiol Pharmacol, 2021; 99(11): 1137-1147. doi: 10.1139/cjpp-2021-0247 [27] DeLeve L D, Kaplowitz N. Glutathione metabolism and its role in hepatotoxicity. Pharmacol Ther, 1991; 52(3): 287-305. doi: 10.1016/0163-7258(91)90029-L [28] Prescher M, Kroll T, Schmitt L. ABCB4/MDR3 in health and disease - at the crossroads of biochemistry and medicine. Biol Chem, 2019; 400(10): 1245-1259. doi: 10.1515/hsz-2018-0441 [29] Wang R, Sheps J A, Ling V. ABC transporters, bile acids, and inflammatory stress in liver cancer. Curr Pharm Biotechnol, 2011; 12(4): 636-646. doi: 10.2174/138920111795163986 [30] Kojima H, Hirao H, Kadono K, et al. Cold stress-induced ferroptosis in liver sinusoidal endothelial cells determines liver transplant injury and outcomes. JCI Insight, 2024; 9(3) : e174354. doi: 10.1172/jci.insight.174354 [31] Jiao X, Li Y, Chen Z, et al. Targeting the PDE3B-cAMP-autophagy axis prevents liver injury in long-term supercooling liver preservation. Sci Transl Med, 2024; 16(775): eadk0636. doi: 10.1126/scitranslmed.adk0636 [32] Zhang J I, Wang S H, Zhao Y J, et al. The role and mechanism of CREBH regulating SIRT3 in metabolic associated fatty liver disease. Life Sci, 2022; 306: 120838. doi: 10.1016/j.lfs.2022.120838 [33] Wang M, Zhang J, Gong N. Role of the PI3K/Akt signaling pathway in liver ischemia reperfusion injury: A narrative review. Ann Palliat Med, 2022; 11(2): 806-817. doi: 10.21037/apm-21-3286 [34] Yao Y, Wang L, Jin P, et al. Methane alleviates carbon tetrachloride induced liver injury in mice: Anti-inflammatory action demonstrated by increased PI3K/Akt/GSK-3beta-mediated IL-10 expression. J Mol Histol, 2017; 48(4): 301-310. doi: 10.1007/s10735-017-9728-1 [35] Zhou Y D, Hou J G, Liu W, et al. 20(R)-ginsenoside Rg3, a rare saponin from red ginseng, ameliorates acetaminophen-induced hepatotoxicity by suppressing PI3K/AKT pathway-mediated inflammation and apoptosis. Int Immunopharmacol, 2018; 59: 21-30. doi: 10.1016/j.intimp.2018.03.030 [36] Wu L, Zhang Q, Mo W, et al. Quercetin prevents hepatic fibrosis by inhibiting hepatic stellate cell activation and reducing autophagy via the TGF-beta1/Smads and PI3K/Akt pathways. Sci Rep, 2017; 7(1): 9289. doi: 10.1038/s41598-017-09673-5 -

 下载:
下载:
 点击查看大图
计量
- 文章访问数: 487
- HTML全文浏览量: 242
- PDF下载量: 17
- 被引次数: 0

