 投稿系统
投稿系统

Correlation of PM2.5 pollution and daily mortality rate of cardiovascular and cerebrovascular diseases in Northeast China through PM2.5 sources analysis
doi: 10.1515/fzm-2024-0019
-
Abstract:
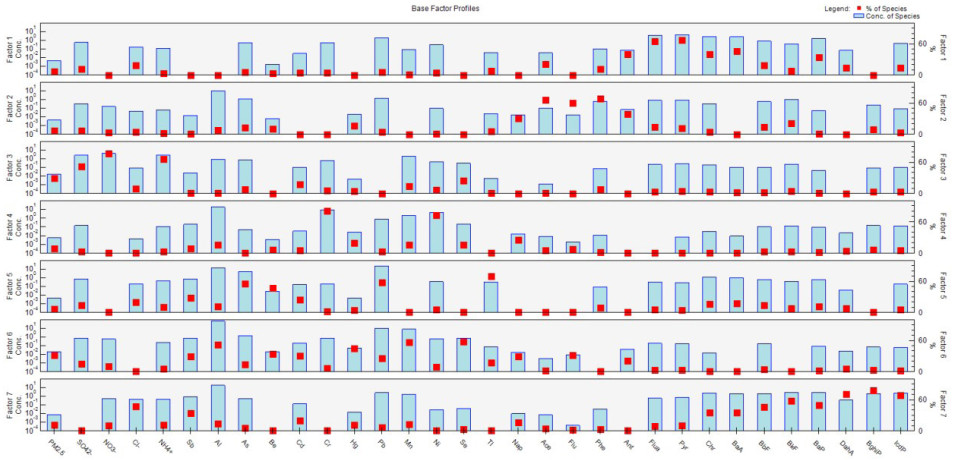
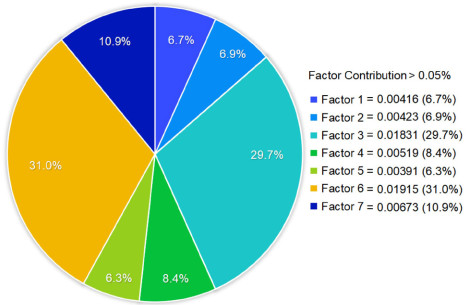
Objective This study aims to evaluate the relationship between PM2.5 concentration and daily mortality rate from cardiovascular and cerebrovascular diseases (CCVD) in cold regions of northern China, as well as to identify the primary sources of PM2.5. Methods A time series analysis model was used to calculate the exposure-response relationship between PM2.5 and CCVD mortality in Harbin. Positive matrix factorization (PMF) was employed to analyze the sources of PM2.5. Results After adjusting for multiple pollutant combinations, the maximum excess risk of cardio-cerebrovascular death on the day of PM2.5 exposure was 0.42% (95% CI: 0.15%-0.70%). Stratification by gender and age revealed that the elderly individuals and men were particularly susceptible to PM2.5 exposure. The source analysis identified seven major pollution sources contributing to PM2.5 in Harbin. Conclusion Our findings strengthen the evidence that PM2.5 is an independent risk factor for daily CCVD mortality, identify vulnerable populations that require special attention, and pinpoint the primary sources of PM2.5 in Harbin. These findings provide reference points for effectively reducing the health risks associated with PM2.5 exposure. -
Key words:
- PM2.5 /
- cardio-cerebrovascular diseases /
- daily mortality /
- time series /
- PMF
-
Table 1. Description of meteorological data, air pollution data and CCVD data of Harbin City from 2016 to 2018
Year 2016 2017 2018 Standard value Mean ± SD Min Max Mean ± SD Min Max Mean ± SD Min Max Temperature (℃) 1.05 ± 16.36 -33.5 25.3 5.23 ± 15.22 -22.38 29.15 5.19 ± 15.79 -29.4 30.8 - Air pressure (hpa) 995.57 ± 9.68 967.4 1021.8 999.69 ± 8.95 977.1 1020 1000.27 ± 9.46 979.2 1025.4 - Relative humidity (%) 67.66 ± 14.78 28 98 63.62 ± 14.68 19 95 64.05 ± 15.94 20.3 95 - Wind velocity (m/s) 2.89 ± 1.47 0.2 9 2.99 ± 1.40 0 9.2 2.97 ± 1.20 0.8 8.1 - SO2 (μg/m3) 27.53 ± 23.70 2.82 101.18 24.19 ± 20.49 4.73 107.45 18.81 ± 16.53 3.45 80 150 NO2 (μg/m3) 42.05 ± 15.9 16.45 134.36 42.64 ± 19.07 11.82 130.45 33.71 ± 13.41 12.91 91.82 80 CO (mg/m3) 1.14 ± 0.37 0.54 3.34 1.03 ± 0.58 0.28 3.65 0.74 ± 0.30 0.38 2.36 4 O3 (μg/m3) 62.97 ± 25.55 12.73 159.09 85.23 ± 34.22 27.91 229.73 75.05 ± 29.10 25 192.64 160 PM2.5 (μg/m3) 54.12 ± 42.84 8 211.64 57.16 ± 62.92 6.45 460.45 37.37 ± 35.57 4.91 263.55 75 CCVD (n) 92.04 ± 14.60 56 153 92.98 ± 13.77 60 135 89.02 ± 15.07 51 134 -  下载: 导出CSV
Table 2. Association between PM2.5 and CCVD mortality with a 10mg/m3 increase in PM2.5: sex-specific, age-specific, and total analysis for Harbin city from 2016 to 2018
lag days Sex Age Total People Male Female Age < 65 Age ≥ 65 ER 95%CI ER 95%CI ER 95%CI ER 95%CI ER 95%CI lag0 0.24 (-0.02, 0.49) 0.37* (0.09, 0.65) 0.37* (0.02, 0.71) 0.27* (0.03, 0.50) 0.29* (0.09, 0.50) lag1 0.28* (0.02, 0.53) 0.15 (-0.13, 0.44) 0.26 (-0.08, 0.61) 0.21 (-0.02, 0.45) 0.23* (0.02, 0.43) lag2 0.39* (0.14, 0.63) 0.30* (0.02, 0.58) 0.28 (-0.06, 0.62) 0.37* (0.15, 0.60) 0.35* (0.15, 0.55) lag3 0.2 (-0.05, 0.45) 0.1 (-0.18, 0.38) 0.09 (-0.25, 0.43) 0.18 (-0.05, 0.41) 0.16 (-0.05, 0.36) lag4 0.27* (0.02, 0.51) 0.05 (-0.22, 0.33) -0.20 (-0.54, 0.14) 0.32* (0.09, 0.54) 0.18 (-0.03, 0.38) lag5 0.31* (0.06, 0.56) 0.29* (0.01, 0.57) 0.16 (-0.18, 0.50) 0.35* (0.13, 0.58) 0.30* (0.10, 0.50) lag6 0.20 (-0.05, 0.45) 0.11 (-0.17, 0.39) 0.15 (-0.19, 0.49) 0.16 (-0.07, 0.40) 0.16 (-0.04, 0.37) lag7 0.25 (0.00, 0.50) 0.12 (-0.16, 0.40) -0.04 (-0.38, 0.31) 0.28* (0.05, 0.51) 0.19 (-0.01, 0.40) CI, confidence interval; ER, relative risk. *P < 0.05..
下载: 导出CSV
Table 3. Association between PM2.5 and CCVD mortality with a 10mg/m3 increase in PM2.5 : single-pollutant and multi-pollutant models for Harbin city from 2016 to 2018
Models lag0 lag1 lag2 lag5 ER 95%CI ER 95%CI ER 95%CI ER 95%CI PM2.5 0.29* (0.09, 0.50) 0.23* (0.02, 0.43) 0.35* (0.15, 0.55) 0.30* (0.10, 0.50) PM2.5 + NO2 0.42* (0.15, 0.69) 0.20 (-0.06, 0.47) 0.19 (-0.07, 0.46) 0.29* (0.02, 0.55) PM2.5 + SO2 0.41* (0.18, 0.65) 0.27* (0.03, 0.50) 0.29* (0.06, 0.53) 0.27* (0.03, 0.50) PM2.5 + O3 0.29* (0.08, 0.50) 0.18 (-0.02, 0.39) 0.30* (0.10, 0.50) 0.29* (0.08, 0.49) PM2.5 + CO 0.35* (0.08, 0.63) 0.17 (-0.10, 0.44) 0.18 (-0.09, 0.44) 0.14 (-0.13, 0.41) PM2.5 + NO2 + SO2 0.42* (0.15, 0.70) 0.21 (-0.06, 0.47) 0.19 (-0.07, 0.46) 0.28* (0.01, 0.55) PM2.5 + NO2 + CO 0.41* (0.12, 0.70) 0.17 (-0.11, 0.46) 0.14 (-0.14, 0.42) 0.19 (-0.09, 0.47) PM2.5 + NO2 + O3 0.41* (0.14, 0.69) 0.15 (-0.12, 0.42) 0.14 (-0.13, 0.40) 0.27 (0, 0.54) PM2.5 + SO2 + CO 0.39* (0.11, 0.66) 0.18 (-0.09, 0.46) 0.17 (-0.09, 0.44) 0.15 (-0.12, 0.42) PM2.5 + SO2 + O3 0.41* (0.17, 0.65) 0.22 (-0.02, 0.45) 0.24 (0, 0.47) 0.25* (0.01, 0.49) PM2.5 + CO + O3 0.35* (0.07, 0.62) 0.11 (-0.16, 0.39) 0.11 (-0.15, 0.38) 0.13 (-0.14, 0.39) PM2.5 + NO2 +SO2+CO 0.40* (0.11, 0.69) 0.17 (-0.12, 0.45) 0.14 (-0.14, 0.42) 0.19 (-0.09, 0.47) PM2.5 + NO2 +SO2+O3 0.42* (0.15, 0.69) 0.16 (-0.11, 0.43) 0.14 (-0.13, 0.40) 0.27 (0, 0.54) PM2.5 + NO2 +O3+CO 0.41* (0.12, 0.70) 0.12 (-0.17, 0.40) 0.08 (-0.20, 0.36) 0.17 (-0.11, 0.46) PM2.5 + SO2 +O3+CO 0.38* (0.11, 0.66) 0.13 (-0.14, 0.40) 0.11 (-0.16, 0.38) 0.13 (-0.14, 0.40) PM2.5 + NO2 +SO2+CO+O3 0.40* (0.11, 0.69) 0.11 (-0.17, 0.40) 0.08 (-0.21, 0.36) 0.17 (-0.11, 0.46) CI, confidence interval; ER, relative risk. *P < 0.05.
下载: 导出CSV
-
[1] Bu X, Xie Z, Liu J, et al. Global PM2.5-attributable health burden from 1990 to 2017: Estimates from the Global Burden of disease study. Environ Res, 2021; 197: 111123. doi: 10.1016/j.envres.2021.111123 [2] Abbas I, Verdin A, Escande F, et al. In vitro short-term exposure to air pollution PM2.5-0.3 induced cell cycle alterations and genetic instability in a human lung cell coculture model. Environ Res, 2016; 147: 146-158. doi: 10.1016/j.envres.2016.01.041 [3] Xing Y F, Xu Y H, Shi M H, et al. The impact of PM2.5 on the human respiratory system. J Thorac Dis, 2016; 8(1): E69-74. http://www.xueshufan.com/publication/2289128632 [4] Martinelli N, Olivieri O, Girelli D. Air particulate matter and cardiovascular disease: a narrative review. Eur J Intern Med, 2013; 24(4): 295-302. doi: 10.1016/j.ejim.2013.04.001 [5] Cao Y, Han X, Zhao X, et al. Pathogenesis and preventive measures of environmentrelated cardiovascular disease in Northern China. Frigid Zone Medicine, 2022; 2(3): 140. doi: 10.2478/fzm-2022-0021 [6] Yeh H L, Hsu S W, Chang Y C, et al. Spatial analysis of ambient PM2.5 exposure and bladder cancer mortality in Taiwan. Int J Environ Res Public Health, 2017; 14(5): 508. doi: 10.3390/ijerph14050508 [7] Wu J, Zhu J, Li W, et al. Estimation of the PM2.5 health effects in China during 2000-2011. Environ Sci Pollut Res Int, 2017; 24(11): 10695-10707. doi: 10.1007/s11356-017-8673-6 [8] Shi T X, Dong H, Yang Y J, et al. Association between PM2.5 air pollution and daily resident mortality in Guangzhou urban area in winter. Journal of Environment and Health, 2015; 32(6): 477-481. http://en.cnki.com.cn/Article_en/CJFDTOTAL-HJYJ201506003.htm [9] Churg A, Brauer M. Human lung parenchyma retains PM2.5. Am J Respir Crit Care Med, 1997; 155(6): 2109-2111. doi: 10.1164/ajrccm.155.6.9196123 [10] Stafoggia M, Cesaroni G, Peters A, et al. Long-term exposure to ambient air pollution and incidence of cerebrovascular events: results from 11 European cohorts within the ESCAPE project. Environ Health Perspect, 2014; 122(9): 919-925. doi: 10.1289/ehp.1307301 [11] Miller K A, Siscovick D S, Sheppard L, et al. Long-term exposure to air pollution and incidence of cardiovascular events in women. N Engl J Med, 2007; 356(5): 447-458. doi: 10.1056/NEJMoa054409 [12] Lin H, Wang X, Qian Z M, et al. Daily exceedance concentration hours: a novel indicator to measure acute cardiovascular effects of PM2.5 in six Chinese subtropical cities. Environ Int, 2018; 111: 117-123. doi: 10.1016/j.envint.2017.11.022 [13] Chen C, Zhu P, Lan L, et al. Short-term exposures to PM2.5 and cause-specific mortality of cardiovascular health in China. Environ Res, 2018; 161: 188-194. doi: 10.1016/j.envres.2017.10.046 [14] Atkinson R W, Butland B K, Anderson H R, et al. Long-term Concentrations of nitrogen dioxide and mortality: a meta-analysis of cohort studies. Epidemiology, 2018; 29(4): 460-472. doi: 10.1097/EDE.0000000000000847 [15] Liu G R, Peng X, Wang R K, et al. A new receptor model-incremental lifetime cancer risk method to quantify the carcinogenic risks associated with sources of particle-bound polycyclic aromatic hydrocarbons from Chengdu in China. J Hazard Mater, 2015; 283: 462-468. doi: 10.1016/j.jhazmat.2014.09.062 [16] Li Z, Hopke P K, Husain L, et al. Sources of fine composition in New York City. Atmospheric Environment, 2004; 38(38): 6521-6529. doi: 10.1016/j.atmosenv.2004.08.040 [17] Qin Y, Oduyemi K. Atmospheric aerosol source identification and estimates of source contributions to air pollution in Dundee. Atmospheric Environment, 2003; 37(13): 1799-1809. doi: 10.1016/S1352-2310(03)00078-5 [18] Xia W W, Liang B, Chen L, et al. Atmospheric wet and dry depositions of polycyclic aromatic compounds in a megacity of Southwest China. Environ Res, 2022; 204(Pt D): 112151. [19] Shi J W, Peng Y, Li W F, et al. Characterization and source identification of PM 10-bound polycyclic aromatic hydrocarbons in urban air of Tianjin, China. Aerosol & Air Quality Research, 2010; 10(5): 507-518. http://aerosol.ieexa.cas.cn/aaqrkw/kwlwqj/201207/W020120731371609240891.pdf [20] Li W, Peng Y, Shi J, et al. Particulate polycyclic aromatic hydrocarbons in the urban Northeast Region of China: profiles, distributions and sources. Atmospheric Environment, 2011; 45(40): 7664-7671. doi: 10.1016/j.atmosenv.2011.04.004 [21] Jenkins B M, Jones A D, Turn S Q, et al. Emission factors for polycyclic aromatic hydrocarbons from biomass burning. Environmental Science & Technology, 1996; (8): 30. [22] Hsu Y C, Lai M H, Wang W C, et al. Characteristics of water-soluble ionic species in fine (PM2.5) and coarse particulate matter (PM10-2.5) in Kaohsiung, southern Taiwan. J Air Waste Manag Assoc, 2008; 58(12): 1579-1589. doi: 10.3155/1047-3289.58.12.1579 [23] Song Y, Xie S, Zhang Y, et al. Source apportionment of PM2.5 in Beijing using principal component analysis/absolute principal component scores and UNMIX. Sci Total Environ, 2006; 372(1): 278-286. doi: 10.1016/j.scitotenv.2006.08.041 [24] Gladtke D, Volkhausen W, Bach B. Erratum to "estimating the contribution of industrial facilities to annual PM10 concentrations at industrially influenced sites". Atmospheric Environment, 2009; 43(40): 6454. doi: 10.1016/j.atmosenv.2009.11.001 [25] Taylor M P, Isley C F, Glover J. Prevalence of childhood lead poisoning and respiratory disease associated with lead smelter emissions. Environ Int, 2019; 127: 340-352. doi: 10.1016/j.envint.2019.01.062 [26] Pokorná P, Hovorka J, Krouzek J, et al. Particulate matter source apportionment in a village situated in industrial region of Central Europe. J Air Waste Manag Assoc, 2013; 63(12): 1412-1421. doi: 10.1080/10962247.2013.825215 [27] Begum B A, Hopke P K. Identification of haze-creating sources from fine particulate matter in Dhaka aerosol using carbon fractions. J Air Waste Manag Assoc, 2013; 63(9): 1046-1057. doi: 10.1080/10962247.2013.784716 [28] Kara M, Hopke P K, Dumanoglu Y, et al. Characterization of PM using multiple site data in a heavily industrialized region of Turkey. Aerosol and Air Quality Research, 2015; 15(1): 11-27. doi: 10.4209/aaqr.2014.02.0039 [29] Venkataraman C, Friedlander S X X. Source Resolution of fine particulate polycyclic aromatic hydrocarbons using a receptor model modified for reactivity. Air Repair, 1994; 44(9): 1103-1108. http://www.onacademic.com/detail/journal_1000036783677010_f406.html [30] Marr L C, Kirchstetter T W, Harley R A, et al. Characterization of polycyclic aromatic hydrocarbons in motor vehicle fuels and exhaust emissions. Environmental Science & Technology: ES & T, 1999; (18): 33. doi: 10.1021/es981227l [31] Rajagopalan S, Al-Kindi S G, Brook R D. Air pollution and cardiovascular disease: JACC State-of-the-Art Review. J Am Coll Cardiol, 2018; 72(17): 2054-2070. doi: 10.1016/j.jacc.2018.07.099 [32] Liu M, Xue X, Zhou B, et al. Population susceptibility differences and effects of air pollution on cardiovascular mortality: epidemiological evidence from a time-series study. Environ Sci Pollut Res Int, 2019; 26(16): 15943-15952. doi: 10.1007/s11356-019-04960-2 [33] Wang Y, Eliot M N, Wellenius G A. Short-term changes in ambient particulate matter and risk of stroke: a systematic review and meta-analysis. J Am Heart Assoc, 2014; 3(4): e000983. doi: 10.1161/JAHA.114.000983 [34] Dirgawati M, Hinwood A, Nedkoff L, et al. Long-term exposure to low air pollutant concentrations and the relationship with all-cause mortality and stroke in older men. Epidemiology, 2019; 30: S82-S89. doi: 10.1097/EDE.0000000000001034 [35] Clougherty J E. A growing role for gender analysis in air pollution epidemiology. Cien Saude Colet, 2011; 16(4): 2221-2238. doi: 10.1590/S1413-81232011000400021 [36] Pope C A, 3rd, Burnett R T, Thurston G D, et al. Cardiovascular mortality and long-term exposure to particulate air pollution: epidemiological evidence of general pathophysiological pathways of disease. Circulation, 2004; 109(1): 71-77. doi: 10.1161/01.CIR.0000108927.80044.7F -

 点击查看大图
图(3) / 表(3)
计量
- 文章访问数: 484
- HTML全文浏览量: 370
- PDF下载量: 19
- 被引次数: 0

