投稿系统
投稿系统

Cold exposure promotes coronavirus infection by altering the gut microbiota and lipid metabolism to reduce host immunity
doi: 10.2478/fzm-2023-0029
-
Abstract:
Objective Cold exposure has been suggested to be advantageous for the spread and infection of the coronavirus, and the gut microbiota influences the severity of the infection by modulating host inflammatory and immune responses. However, it remains unclear whether the promotion of viral infection through cold exposure is linked to the gut microbiota. Methods In this study, we performed an unbiased analysis of gut microbiota, serum, and lung tissue metabolome changes in cold-exposed and virus-infected mice, alongside the assessment of immune-inflammatory indicators in serum and lung tissue. Results The results revealed that both cold exposure and viral infection significantly decreased the percentage of peripheral blood lymphocytes (CD4+ T cells, CD8+ T cells, and B cell) and increased the expression of inflammatory factors (IL-6, IL-1β, TNF-α, and IFN-γ). Meanwhile, cold exposure disrupted the homeostasis of gut microbiota, elevating the abundance of pathogenic bacteria (Staphylococcus) and diminishing the abundance of beneficial bacteria (Alistipes). Notably, in virus-infected mice exposed to a cold environment, the reduction in the abundance of beneficial bacteria Alistipes was more pronounced than in cases of single virus infection and cold exposure. Analysis of altered serum and lung tissue metabolites highlighted glycerophospholipids, fatty acids, and eicosanoids as the most affected metabolites by cold exposure. These metabolites, closely associated with virus infection, exhibited a significant correlation with immune-inflammatory indicators. Conclusion These findings establish a mechanistic connection between cold exposure and virus infection, suggesting that cold exposure-induced dysregulation of gut microbiota and lipid metabolism diminishes host immunity, promoting virus infection. -
Key words:
- cold exposure /
- coronavirus infection /
- gut microbiota /
- lipid metabolism /
- immune
-

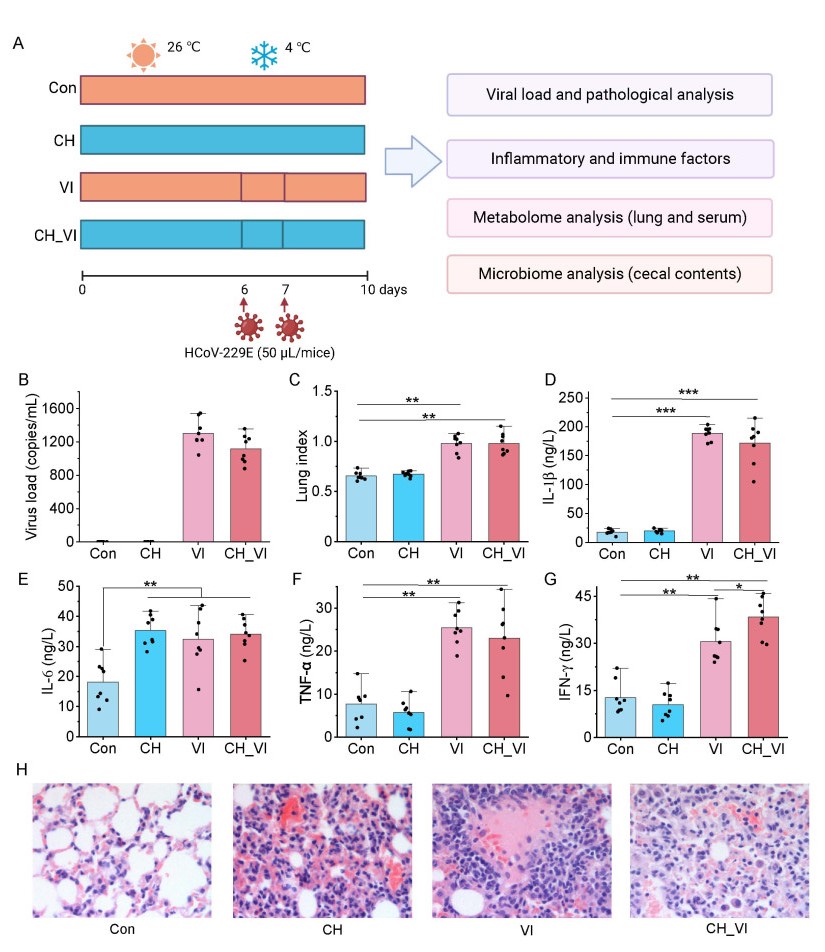
Figure 1. Phenotypic changes in cold-exposed and virus-infected mice. Con, control group; CH, cold humid exposure group; VI, virus infection group; CH_VI, cold humid environment combined with virus infection group. (A) Experimental process; (B) Viral load detection; (C) Lung index; (D-G) The levels of inflammatory cytokines in lung tissue (IL-1β, IL-6, TNF-α, and IFN-γ); (H) Lung histopathological photographs (H&E staining). Significance was evaluated by one-way ANOVA, follow by Dunnett's multiple comparisons test. *, P < 0.05; **, P < 0.01; ***, P < 0.001; N = 8 each group.

Figure 2. The levels of peripheral blood lymphocyte (CD4+- and CD8+-T cells and B cells) in cold exposure and viral infection mice. Significance was evaluated by one-way ANOVA, follow by Dunnett's multiple comparisons test. *, P < 0.05; **, P < 0.01; N = 8 each group.

Figure 3. Analysis of gut microbiota structure in mice subject to cold exposure and virus infection. Con, control group; CH, cold humid exposure group; VI, virus infection group; CH_VI, cold humid environment combined with virus infection group. (A-B) α diversity analysis (Chao and Shannon) at the genus level; (C) Bar chart showing the phylum-levels composition of the gut microbiome; (D-E) Changes in the abundance of Firmicutes and Bacteroidota in mice subjected to cold exposure and virus infection; (F) Principal coordinates analysis (PCoA) based on genus level; (G) Genus level multi-group comparison chart; (H) Cladogram visualizing the output of the LEfSe analysis; (I) The most significant difference of gut microbial taxa among groups after LDA (LDA > 4). The abbreviations are as follows: p, phylum; c, class; o, order; f, family; and g, genus. *, P < 0.05; **, P < 0.01; N = 3 each group.

Figure 4. Species difference analysis based on genus level. Con, control group; CH, cold humid exposure group; VI, virus infection group; CH_VI, cold humid environment combined with virus infection group. (A) CH vs. Con; (B) VI vs. Con; (C) CH_VI vs. Con. N = 3 each group.

Figure 5. Metabolome analysis of lung tissue specimens. Con, control group; CH, cold humid exposure group; VI, virus infection group; CH_VI, cold humid environment combined with virus infection group. (A-C) Volcano plot showing changes in differential ions between CH, VI, CH_VI and Con group; (D) Venn diagram of DMs in the Con, CH, VI and CH_VI groups; (E) The PCA plots established based on DMs in the Con, CH, VI and CH_VI groups; (F) The categories and number of DMs obtained from the Con, CH, VI and CH_VI groups; (G) Heatmap diagram of DMs in the Con, CH, VI and CH_VI groups; (H) The DMs correlation between major DMs classes in the CH group; (I) The DMs correlation between major DMs classes in the VI group; (J) The DMs correlation between major DMs classes in the CH_VI group.

Figure 6. Metabolome analysis of serum samples. Con, control group; CH, cold humid exposure group; VI, virus infection group; CH_VI, cold humid environment combined with virus infection group. (A-C) Volcano plot showing changes in differential ions between CH, VI, CH_VI and Con group; (D) Venn diagram of DMs in the Con, CH, VI and CH_VI groups; (E) The PCA plots established based on DMs in the Con, CH, VI and CH_VI groups; (F) The categories and number of DMs obtained from the Con, CH, VI and CH_VI groups; (G) Heatmap diagram of DMs in the Con, CH, VI and CH_VI groups; (H) The DMs correlation between major DMs classes in the CH group; (I) The DMs correlation between major DMs classes in the VI group; (J) The DMs correlation between major DMs classes in the CH_VI group.

Figure 7. Pathway enrichment analysis of differential metabolites (DMs) in lung tissue specimens and serum samples. Con, control group; CH, cold humid exposure group; VI, virus infection group; CH_VI, cold humid environment combined with virus infection group. (A) serum; (B) Lung tissue.

Figure 8. Correlation analysis. Con, control group; CH, cold humid exposure group; VI, virus infection group; CH_VI, cold humid environment combined with virus infection group. (A) Spearman correlation analysis of differential metabolites (DMs) in lung tissue with immune-inflammatory indicators; (B) The categories and number of significantly (P < 0.05 and |cor| > 0.5) correlated DMs in lung tissue; (C) Spearman correlation analysis of DMs in serum with immune-inflammatory indicators; (D) The categories and number of significantly (P < 0.05 and |cor| > 0.5) correlated DMs in serum; (E) Spearman correlation analysis of the gut microbiota with immune-inflammatory indicators. Significance levels are indicated as follows: *, P < 0.05.
-
[1] Abdelrahman Z, Li M, Wang X. Comparative review of sars-cov-2, sars-cov, mers-cov, and influenza a respiratory viruses. Front Immunol, 2020; 11: 552909. doi: 10.3389/fimmu.2020.552909 [2] Karki R, Lee S, Mall R, et al. Zbp1-dependent inflammatory cell death, panoptosis, and cytokine storm disrupt ifn therapeutic efficacy during coronavirus infection. Sci Immunol, 2022; 7(74): eabo6294. doi: 10.1126/sciimmunol.abo6294 [3] Abid M B, Mughal M, Abid M A. Coronavirus disease 2019 (covid-19) and immune-engaging cancer treatment. JAMA Oncol, 2020; 6(10): 1529–1530. doi: 10.1001/jamaoncol.2020.2367 [4] Ye L, Jiang Y, Zhang M. Crosstalk between glucose metabolism, lactate production and immune response modulation. Cytokine Growth Factor Rev, 2022; 68: 81–92. doi: 10.1016/j.cytogfr.2022.11.001 [5] Spiljar M, Steinbach K, Rigo D, et al. Cold exposure protects from neuroinflammation through immunologic reprogramming. Cell Metab, 2021; 33 (11): 2231–2246. e8. doi: 10.1016/j.cmet.2021.10.002 [6] Dai H, Tang H, Sun W, et al. It is time to acknowledge coronavirus transmission via frozen and chilled foods: Undeniable evidence from china and lessons for the world. Sci Total Environ, 2023; 868: 161388. doi: 10.1016/j.scitotenv.2023.161388 [7] Zuo T, Zhang F, Lui G C Y, et al. Alterations in gut microbiota of patients with covid-19 during time of hospitalization. Gastroenterology, 2020; 159(3): 944–955. e8. doi: 10.1053/j.gastro.2020.05.048 [8] Liu Q, Mak J W Y, et al. Gut microbiota dynamics in a prospective cohort of patients with post-acute covid-19 syndrome. Gut, 2022; 71(3): 544–552. doi: 10.1136/gutjnl-2021-325989 [9] Ren Z, Wang H, Cui G, et al. Alterations in the human oral and gut microbiomes and lipidomics in covid-19. Gut, 2021; 70(7): 1253–1265. doi: 10.1136/gutjnl-2020-323826 [10] Yeoh Y K, Zuo T, Lui G C, et al. Gut microbiota composition reflects disease severity and dysfunctional immune responses in patients with covid-19. Gut, 2021; 70(4): 698–706. doi: 10.1136/gutjnl-2020-323020 [11] Nagata N, Takeuchi T, Masuoka H, et al. Human gut microbiota and its metabolites impact immune responses in covid-19 and its complications. Gastroenterology, 2023; 164(2): 272–288. doi: 10.1053/j.gastro.2022.09.024 [12] Katz-Agranov N, Zandman-Goddard G. Autoimmunity and covid-19 - the microbiotal connection. Autoimmun Rev, 2021; 20(8): 102865. doi: 10.1016/j.autrev.2021.102865 [13] Sun Z, Song Z G, Liu C, et al. Gut microbiome alterations and gut barrier dysfunction are associated with host immune homeostasis in covid-19 patients. BMC Med, 2022; 20(1): 24. doi: 10.1186/s12916-021-02212-0 [14] Vatanen T, Kostic A D, d'Hennezel E, et al. Variation in microbiome lps immunogenicity contributes to autoimmunity in humans. Cell, 2016; 165(4): 842–853. doi: 10.1016/j.cell.2016.04.007 [15] Chevalier C, Stojanovic O, Colin D J, et al. Gut microbiota orchestrates energy homeostasis during cold. Cell, 2015; 163(6): 1360-1374. [16] Huang D, Taha M S, Nocera A L, et al. Cold exposure impairs extracellular vesicle swarm-mediated nasal antiviral immunity. J Allergy Clin Immunol, 2023; 151(2): 509–525. e8. doi: 10.1016/j.jaci.2022.09.037 [17] Tian S, Zheng N, Zu X, et al. Integrated hepatic single-cell rna sequencing and untargeted metabolomics reveals the immune and metabolic modulation of qing-fei-pai-du decoction in mice with coronavirus-induced pneumonia. Phytomedicine, 2022; 97: 153922. doi: 10.1016/j.phymed.2021.153922 [18] Wu G, Zhang W, Zheng N, et al. Integrated microbiome and metabolome analysis reveals the potential therapeutic mechanism of qing-fei-pai-du decoction in mice with coronavirus-induced pneumonia. Front Cell Infect Microbiol, 2022; 12: 950983. doi: 10.3389/fcimb.2022.950983 [19] Gilbert J A, Blaser M J, Caporaso J G, et al. Current understanding of the human microbiome. Nat Med, 2018; 24(4): 392–400. doi: 10.1038/nm.4517 [20] Parker B J, Wearsch P A, Veloo A C M, et al. The genus Alistipes: Gut bacteria with emerging implications to inflammation, cancer, and mental health. Front Immunol, 2020; 11: 906. doi: 10.3389/fimmu.2020.00906 [21] Broker B M, Holtfreter S, Bekeredjian-Ding I. Immune control of Staphylococcus aureus - regulation and counter-regulation of the adaptive immune response. Int J Med Microbiol, 2014; 304(2): 204–214. doi: 10.1016/j.ijmm.2013.11.008 [22] Tsai C M, Caldera J R, Hajam I A, et al. Non-protective immune imprint underlies failure of Staphylococcus aureus isdb vaccine. Cell Host Microbe, 2022; 30(8): 1163–1172. e6. doi: 10.1016/j.chom.2022.06.006 [23] Zheng L, Kelly C J, Battista K D, et al. Microbial-derived butyrate promotes epithelial barrier function through il-10 receptor-dependent repression of claudin-2. J Immunol, 2017; 199(8): 2976–2984. doi: 10.4049/jimmunol.1700105 [24] Klaring K, Just S, Lagkouvardos I, et al. Murimonas intestini gen. Nov., sp. Nov., an acetate-producing bacterium of the family lachnospiraceae isolated from the mouse gut. Int J Syst Evol Microbiol, 2015; 65(Pt 3): 870–878. [25] Yusufu I, Ding K, Smith K, et al. A tryptophan-deficient diet induces gut microbiota dysbiosis and increases systemic inflammation in aged mice. Int J Mol Sci, 2021; 22(9): 5005. doi: 10.3390/ijms22095005 [26] Castane H, Iftimie S, Baiges-Gaya G, et al. Machine learning and semi-targeted lipidomics identify distinct serum lipid signatures in hospitalized covid-19-positive and covid-19-negative patients. Metabolism, 2022; 131: 155197. doi: 10.1016/j.metabol.2022.155197 [27] Ikaheimo T M, Jaakkola K, Jokelainen J, et al. A decrease in temperature and humidity precedes human rhinovirus infections in a cold climate. Viruses, 2016; 8(9): 244. doi: 10.3390/v8090244 [28] Jaakkola K, Saukkoriipi A, Jokelainen J, et al. Decline in temperature and humidity increases the occurrence of influenza in cold climate. Environ Health, 2014; 13(1): 22. doi: 10.1186/1476-069X-13-22 [29] Foxman E F, Storer J A, Fitzgerald M E, et al. Temperature-dependent innate defense against the common cold virus limits viral replication at warm temperature in mouse airway cells. Proc Natl Acad Sci U S A, 2015; 112(3): 827–832. doi: 10.1073/pnas.1411030112 [30] Foxman E F, Storer J A, et al. Two interferon-independent double-stranded rna-induced host defense strategies suppress the common cold virus at warm temperature. Proc Natl Acad Sci U S A, 2016; 113(30): 8496–8501. doi: 10.1073/pnas.1601942113 [31] Shephard R J, Shek P N. Cold exposure and immune function. Can J Physiol Pharmacol, 1998; 76(9): 828–836. doi: 10.1139/y98-097 [32] Zheng D, Liwinski T, Elinav E. Interaction between microbiota and immunity in health and disease. Cell Res, 2020; 30(6): 492–506. doi: 10.1038/s41422-020-0332-7 [33] Garcia-Vidal C, Sanjuan G, Moreno-Garcia E, et al. Incidence of co-infections and superinfections in hospitalized patients with covid-19: A retrospective cohort study. Clin Microbiol Infect, 2021; 27(1): 83–88. doi: 10.1016/j.cmi.2020.07.041 [34] Gao J, Xu K, Liu H, et al. Impact of the gut microbiota on intestinal immunity mediated by tryptophan metabolism. Front Cell Infect Microbiol, 2018; 8: 13. doi: 10.3389/fcimb.2018.00013 [35] Mulcahy M E, McLoughlin R M. Staphylococcus aureus and influenza a virus: Partners in coinfection. mBio, 2016; 7(6): e02068–16. [36] Zhang X Y, Sukhchuluun G, Bo T B, et al. Huddling remodels gut microbiota to reduce energy requirements in a small mammal species during cold exposure. Microbiome, 2018; 6(1): 103. doi: 10.1186/s40168-018-0473-9 [37] Walsh N P, Whitham M. Exercising in environmental extremes : A greater threat to immune function? Sports Med, 2006; 36(11): 941–976. doi: 10.2165/00007256-200636110-00003 [38] Okin D, Medzhitov R. Evolution of inflammatory diseases. Curr Biol, 2012; 22(17): R733–40. doi: 10.1016/j.cub.2012.07.029 [39] Huang Z, Xie N, Illes P, et al. From purines to purinergic signalling: Molecular functions and human diseases. Signal Transduct Target Ther, 2021; 6(1): 162. doi: 10.1038/s41392-021-00553-z [40] Longhi M S, Moss A, Jiang Z G, et al. Purinergic signaling during intestinal inflammation. J Mol Med (Berl), 2017; 95(9): 915–925. doi: 10.1007/s00109-017-1545-1 [41] Yang R, Yang C, Ma L, et al. Identification of purine biosynthesis as an nadh-sensing pathway to mediate energy stress. Nat Commun, 2022; 13(1): 7031. doi: 10.1038/s41467-022-34850-0 [42] Wu J, Wei Z, Cheng P, et al. Rhein modulates host purine metabolism in intestine through gut microbiota and ameliorates experimental colitis. Theranostics, 2020; 10(23): 10665–10679. doi: 10.7150/thno.43528 [43] Mager L F, Burkhard R, Pett N, et al. Microbiome-derived inosine modulates response to checkpoint inhibitor immunotherapy. Science, 2020; 369(6510): 1481–1489. doi: 10.1126/science.abc3421 [44] Bley H, Schobel A, Herker E. Whole lotta lipids-from hcv rna replication to the mature viral particle. Int J Mol Sci, 2020; 21(8): 2888. doi: 10.3390/ijms21082888 [45] Song J W, Lam S M, Fan X, et al. Omics-driven systems interrogation of metabolic dysregulation in covid-19 pathogenesis. Cell Metab, 2020; 32(2): 188-202 e5. doi: 10.1016/j.cmet.2020.06.016 [46] Barberis E, Timo S, Amede E, et al. Large-scale plasma analysis revealed new mechanisms and molecules associated with the host response to sars-cov-2. Int J Mol Sci, 2020; 21(22): 8623. doi: 10.3390/ijms21228623 [47] Makide K, Kitamura H, Sato Y, et al. Emerging lysophospholipid mediators, lysophosphatidylserine, lysophosphatidylthreonine, lysophosphatidylethanolamine and lysophosphatidylglycerol. Prostaglandins Other Lipid Mediat, 2009; 89(3-4): 135–139. doi: 10.1016/j.prostaglandins.2009.04.009 [48] Shindou H, Hishikawa D, Harayama T, et al. Generation of membrane diversity by lysophospholipid acyltransferases. J Biochem, 2013; 154(1): 21–28. doi: 10.1093/jb/mvt048 [49] Sevastou I, Kaffe E, Mouratis M A, et al. Lysoglycerophospholipids in chronic inflammatory disorders: The pla(2)/lpc and atx/lpa axes. Biochim Biophys Acta, 2013; 1831(1): 42–60. doi: 10.1016/j.bbalip.2012.07.019 -
 fzm-3-4-216_ESM.pdf

-

 下载:
下载:


 点击查看大图
计量
- 文章访问数: 664
- HTML全文浏览量: 342
- PDF下载量: 20
- 被引次数: 0