投稿系统
投稿系统

The effects of cold region meteorology and specific environment on the number of hospital admissions for chronic kidney disease: An investigate with a distributed lag nonlinear model
doi: 10.2478/fzm-2023-0009
-
Abstract:
Objective To explore the effects of daily mean temperature (℃), average daily air pressure (hPa), humidity (%), wind speed (m/s), particulate matter (PM) 2.5 (μg/m3) and PM10 (μg/m3) on the admission rate of chronic kidney disease (CKD) patients admitted to the Second Affiliated Hospital of Harbin Medical University in Harbin and to identify the indexes and lag days that impose the most critical influence. Methods The R language Distributed Lag Nonlinear Model (DLNM), Excel, and SPSS were used to analyze the disease and meteorological data of Harbin from 01 January 2010 to 31 December 2019 according to the inclusion and exclusion criteria. Results Meteorological factors and air pollution influence the number of hospitalizations of CKD to vary degrees in cold regions, and differ in persistence or delay. Non-optimal temperature increases the risk of admission of CKD, high temperature increases the risk of obstructive kidney disease, and low temperature increases the risk of other major types of chronic kidney disease. The greater the temperature difference is, the higher its contribution is to the risk. The non-optimal wind speed and non-optimal atmospheric pressure are associated with increased hospital admissions. PM2.5 concentrations above 40 μg/m3 have a negative impact on the results. Conclusion Cold region meteorology and specific environment do have an impact on the number of hospital admissions for chronic kidney disease, and we can apply DLMN to describe the analysis. -

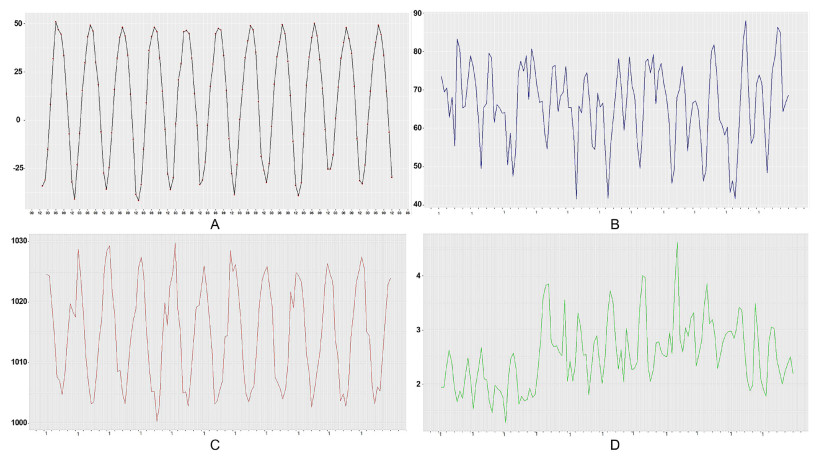
Figure 1. Line chart of monthly mean meteorological elements in Harbin from 2010 to 2020
(A) Monthly average temperature Line Chart: The lowest monthly average temperature shows a fluctuating upward trend; (B) Monthly average humidity line chart: Since 2019, the snowfall in winter has decreased significantly, and the precipitation in summer has increased significantly with overall increasing precipitation. (C) Monthly mean atmospheric pressure broken line chart: the high-level atmospheric pressure slightly decreased, whereas the low-level atmospheric pressure slightly increased, and the overall change of atmospheric pressure was significantly related to the season, showing a trend of low in summer and high in winter. (D) Monthly average wind speed broken line chart: from January 2013 to May 2017, the monthly average wind speed reached 4.61m /s, then gradually decreased in 2019.

Figure 2. Annual cold wave days in Harbin from 2010 to 2020 with a maximum of 133 days and a minimum of 82 days

Figure 3. Changes of PM2.5 and PM10 concentrations in Harbin from 2013 to 2020. The overall trend was downward, and the concentration was higher in winter

Figure 4. Composition of age and sex of chronic kidney disease (CKD) patients admitted to the Second Hospital of Harbin Medical University for ten years

Figure 5. The time distribution of patients with chronic kidney disease (CKD) admitted to the Second Hospital of Harbin Medical University in Harbin from 2010 to 2020
(A) The etiological diagnosis of CKD patients admitted to the Second Hospital of Medical University in Harbin. The top ranked etiological diagnosis in the past ten years: glomerular disease (18%), obstructive nephropathy (15%), diabetes nephropathy (5%), hypertensive nephropathy (3%), and chronic kidney disease (51%) with different CKD stages (no cause specified); (B) Seasonal changes of etiological diagnosis of patients with chronic kidney disease admitted to the Second Hospital of Medical University in Harbin. Diabetes nephropathy and glomerular disease occur most frequently in spring, obstructive nephropathy in summer, and hypertensive nephropathy and chronic kidney disease in autumn

Figure 6. Stacking chart of daily and monthly changes of the number of chronic kidney disease (CKD) patients admitted to the Second Hospital of Harbin Medical University in Harbin. The maximum number of inpatients was 31, dated on 09 October 2017, followed by 28 on 08 October 2019. This pattern might be related to outpatient service after the National Day holiday. The number of people has fluctuated and increased in the first five years and remained relatively stable at a high level in the last five years, which is presumably related to the adjustment of local reimbursement policies. The number of hospital admissions each year basically presents a "M" type change with the month, and the rising trend occurs in winter and spring seasons (February to April) and in autumn and winter seasons (October to December), both of which belong to the seasonal change period

Figure 7. Impact of ten-year daily average temperature and hysteresis on chronic kidney disease (CKD) in Harbin

Figure 8. Impact of ten-year daily temperature difference and hysteresis on chronic kidney disease (CKD) in Harbin

Figure 9. Impact of 10-year daily wind speed and lag on chronic kidney disease (CKD) in Harbin

Figure 10. Impact of ten-year daily pressure and hysteresis on chronic kidney disease (CKD) in Harbin
Table 1. Effect value of extremely low daily average temperature on the number of inpatients with different lag days in each subgroup
Number -29.4℃ RR (95%CI) lag0 lag10 lag20 lag30 Gender Male 10 531 1.05[0.92-1.19] 1.00[0.93-1.07] 0.97[0.91-1.04] 1.19[1.05-1.34] Female 8 124 1.00[0.88-1.14] 1.04[0.97-1.12] 1.01[0.94-1.08] 1.17[1.02-1.33] Age < 65 13 396 1.02[0.90-1.15] 1.00[0.94-1.07] 0.96[0.90-1.02] 1.21[1.08-1.36] ≥ 65 5 259 1.05[0.90-1.22] 1.06[0.97-1.15] 1.06[0.98-1.15] 1.09[0.90-1.27] Main diagnosis of etiology Obstructive nephropathy 2 725 1.02[0.83-1.26] 0.97[0.26-1.09] 0.89[0.80-1.00] 1.43[1.17-1.76] Diabetes nephropathy 966 1.13[0.83-1.54] 1.09[0.92-1.30] 0.97[0.83-1.14] 0.92[0.69-1.22] Hypertension nephropathy 457 1.01[0.65-1.55] 1.28[1.01-1.62] 1.09[0.87-1.36] 1.68[1.10-2.56] Glomerular nephropathy 3 397 1.07[0.89-1.28] 1.03[0.93-1.14] 0.99[0.90-1.09] 1.26[1.05-1.50] CKD of unknown etiology 9 593 1.0[0.91-1.16] 1.02[0.96-1.10] 1.01[0.95-1.08] 1.12[0.99-1.25]  下载: 导出CSV
-
[1] Campbell-Lendrum D, Prüss-Ustün A. Climate change, air pollution and noncommunicable diseases. Bull World Health Organ, 2019; 97(2): 160-161. doi: 10.2471/BLT.18.224295 [2] Zhang L, Zhao M H, Zuo L, et al. China kidney disease network (CK-NET) 2016 annual data report. Kidney Int Suppl (2011), 2020; 10(2): e97-e185. doi: 10.1016/j.kisu.2020.09.001 [3] Chen R S, Kang E S, Li-Zong W U, et al. Cold Regions in China. Cold Regions Sci Tech, 2006, 45(2): 95-102. doi: 10.1016/j.coldregions.2006.03.001 [4] Wei X R, Wang Y C. Contemporary understanding of the risk factors for chronic kidney disease in cold area. FZM, 2022; 2(4): 204-213. [5] Marchant B, Ranjadayalan K, Stevenson R. Circadian and seasonal factors in the pathogenesis of acute myocardial infarction: the influence of environmental temperature. Heart, 1993; 69(5): 385-387 doi: 10.1136/hrt.69.5.385 [6] Patten S B, Williams J V, Lavorato D H, et al. Major depression prevalence increases with latitude in Canada. Can J Psychiatry, 2017; 62(1): 62-66. doi: 10.1177/0706743716673323 [7] Falla M, Micarelli A, Hüfner K, et al. The effect of cold exposure on cognitive performance in healthy adults: a systematic review. Int J Environ Res Public Health, 2021; 18(18): 9725. doi: 10.3390/ijerph18189725 [8] Liu J, Varghese B M, Hansen A, et al. Hot weather as a risk factor for kidney disease outcomes: A systematic review and meta-analysis of epidemiological evidence. Sci Total Environ, 2021; 801: 149806. doi: 10.1016/j.scitotenv.2021.149806 [9] He L, Xue B, Wang B, et al. Impact of high, low, and non-optimum temperatures on chronic kidney disease in a changing climate, 1990-2019: A global analysis. Environ Res, 2022; 212(Pt A): 113172. [10] Duan J W, Li Y L, Li S X, et al. Association of long-term ambient fine particulate matter (PM2.5) and incident CKD: a prospective cohort study in China. Am J Kidney Dis, 2022; 80(5): 638-647. doi: 10.1053/j.ajkd.2022.03.009 [11] Armstrong B. Models for the relationship between ambient temperature and daily mortality. Epidemiology, 2006; 17(6): 624-631. doi: 10.1097/01.ede.0000239732.50999.8f [12] Gasparrini A, Armstrong B, Kenward M G. Distributed lag non-linear models. Stat Med, 2010; 29(21): 2224-2234. doi: 10.1002/sim.3940 [13] Gasparrini A, Armstrong B. Distributed lag non-linear models in R: the package dlnm. J Stat Softw, 2011; 43(8): 1-20. [14] Chen T K, Knicely D H, Grams M E. Chronic kidney disease diagnosis and management: a review. JAMA, 2019; 322(13): 1294-1304. doi: 10.1001/jama.2019.14745 [15] Cui L, Geng X, Ding T, et al. Impact of ambient temperature on hospital admissions for cardiovascular disease in Hefei City, China. Int J Biometeorol, 2019; 63(6): 723-734. doi: 10.1007/s00484-019-01687-0 [16] Eckardt K, Coresh J, Devuyst O, et al. Evolving importance of kidney disease: from subspecialty to global health burden. Lancet, 2013; 382: 158-169 doi: 10.1016/S0140-6736(13)60439-0 [17] GBD 2017 Causes of Death Collaborators. Global, regional, and national age-sex-specific mortality for 282 causes of death in 195 countries and territories, 1980-2017: A systematic analysis for the global burden of disease study 2017. Lancet, 2018; 392: 1736-1788 doi: 10.1016/S0140-6736(18)32203-7 [18] Armstrong McKay D I, Staal A, Abrams J F, et al. Exceeding 1.5℃ global warming could trigger multiple climate tipping points. Science, 2022; 377(6611): eabn7950. doi: 10.1126/science.abn7950 [19] Wada Y, Hamamoto Y, Ikeda H, et al. Seasonal variations of urinary albumin creatinine ratio in Japanese subjects with Type 2 diabetes and early nephropathy. Diabet Med, 2012; 29(4): 506-508. doi: 10.1111/j.1464-5491.2011.03472.x [20] Schlesinger N, Schlesinger M, Seshan S V. Seasonal variation of lupus nephritis: high prevalence of class V lupus nephritis during the winter and spring. J Rheumatol, 2005; 32(6): 1053-1057. [21] Krummel T, Ingwiller M, Keller N, et al. Effects of high- vs low-dose native vitamin D on albuminuria and the renin-angiotensin-aldosterone system: a randomized pilot study. Int Urol Nephrol, 2022; 54(4): 895-905. doi: 10.1007/s11255-021-02950-3 [22] Han Y, Du J, Wang J, et al. Cold Pressor Test in Primary Hypertension: A Cross-Sectional Study. Front Cardiovasc Med. 2022; 9: 860322. doi: 10.3389/fcvm.2022.860322 [23] Goel H, Shah K, Kumar A, et al. Temperature, cardiovascular mortality, and the role of hypertension and renin-angiotensin-aldosterone axis in seasonal adversity: a narrative review. J Hum Hypertens, 2022; 36(12): 1035-1047. doi: 10.1038/s41371-022-00707-8 [24] Chen Z, Liu P, Xia X, et al. The underlying mechanisms of cold exposure-induced ischemic stroke. Sci Total Environ, 2022; 834: 155514. doi: 10.1016/j.scitotenv.2022.155514 [25] Lee S, Kim M S, Kim J H, et al. Daily Mean Temperature Affects Urolithiasis Presentation in Seoul: a Time-series Analysis. J Korean Med Sci, 2016; 31(5): 750-756. doi: 10.3346/jkms.2016.31.5.750 [26] Vicedo-Cabrera A M, Goldfarb D S, Kopp RE, et al. Sex differences in the temperature dependence of kidney stone presentations: a population-based aggregated case-crossover study. Urolithiasis, 2020; 48(1): 37-46. doi: 10.1007/s00240-019-01129-x [27] García-Arroyo F E, Cristóbal M, Arellano-Buendía A S, et al. Rehydration with soft drink-like beverages exacerbates dehydration and worsens dehydration-associated renal injury. Am J Physiol Regul Integr Comp Physiol, 2016; 311(1): R57-R65. doi: 10.1152/ajpregu.00354.2015 [28] Zhang Y, Zou B, Zhang H, et al. Empirical Research on Male Preference in China: A Result of Gender Imbalance in the Seventh Population Census. Int J Environ Res Public Health, 2022; 19(11): 6482. doi: 10.3390/ijerph19116482 [29] Jimenez-Conde J, Ois A, Gomis M, et al. Weather as a trigger of stroke. Daily meteorological factors and incidence of stroke subtypes. Cerebrovasc Dis, 2008; 26(4): 348-54. doi: 10.1159/000151637 [30] Coccia M. How do low wind speeds and high levels of air pollution support the spread of COVID-19? Atmos Pollut Res, 2021; 12(1): 437-445. doi: 10.1016/j.apr.2020.10.002 [31] Sang S, Chu C, Zhang T, et al. The global burden of disease attributable to ambient fine particulate matter in 204 countries and territories, 1990-2019: A systematic analysis of the Global Burden of Disease Study 2019. Ecotoxicol Environ Saf, 2022; 238: 113588. doi: 10.1016/j.ecoenv.2022.113588 [32] He M, Ichinose T, Ito T, et al. Investigation of inflammation inducing substances in PM2.5 particles by an elimination method using thermal decomposition. Environ Toxicol, 2019; 34: 1137-1148 doi: 10.1002/tox.22816 [33] Liang S, Zhao T, Hu H, et al. Repeat dose exposure of PM2.5 triggers the disseminated intravascular coagulation (DIC) in SD rats. Sci Total Environ, 2019; 663: 245-253. doi: 10.1016/j.scitotenv.2019.01.346 [34] Nemmar A, Al-Salam S, Zia S, et al. Diesel exhaust particles in the lung aggravate experimental acute renal failure. Toxicol Sci, 2010; 113: 267-277. doi: 10.1093/toxsci/kfp222 [35] Ji P Y, Li Z Y, Wang H, et al. Arsenic and sulfur dioxide co-exposure induce renal injury via activation of the NF-κB and caspase signaling pathway. Chemosphere, 2019; 224: 280-288. doi: 10.1016/j.chemosphere.2019.02.111 [36] Kuang X. A study on the key role of cadmium accumulation induced by PM2.5 exposure in renal injury. ISEE Conference Abstracts, 2018; 2018(1). [37] Liu J, Han Y, Tang X, et al. Estimating adult mortality attributable to PM2.5 exposure in China with assimilated PM2.5 concentrations based on a ground monitoring network. Sci Total Environ, 2016; 568: 1253-1262. doi: 10.1016/j.scitotenv.2016.05.165 [38] Chen S, Dong H, Li M, et al. Interactive effects between temperature and PM2.5 on mortality: a study of varying coefficient distributed lag model -Guangzhou, Guangdong Province, China, 2013-2020. China CDC Wkly, 2022; 4(26): 570-576. doi: 10.46234/ccdcw2022.124 -


 点击查看大图
计量
- 文章访问数: 1640
- HTML全文浏览量: 732
- PDF下载量: 39
- 被引次数: 0